Figure 3.
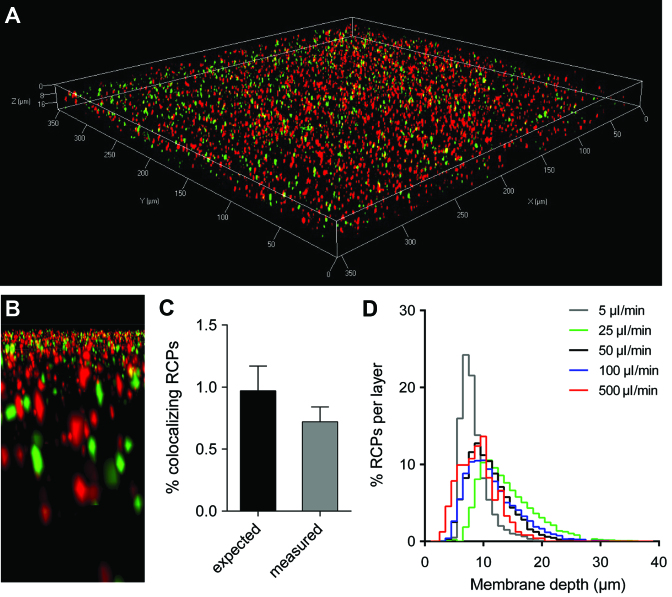
Enriched RCPs at high concentration can be resolved via confocal microscopy. (A) 3D rendered confocal Z stack of 1 pM RCPs labelled with either Cy3 or FITC, and enriched on a NC membrane. (B) A detailed 3D rendered region inside the membrane with Cy3 and FITC labelled RCPs. (C) Co-localization measurement of enriched RCPs and expected numbers of co-localization by chance. Artificial images with objects with random distributions and the same number, size and intensity of the measured RCPs were generated and co-localization were measured with the same parameters (Error bars ±1 st. dev. of the mean, n = 5 for random images, n = 3 for measured RCP images). (D) Distribution of RCP localization inside the membrane as a function of different flow rates used during enrichment.

