Figure 4.
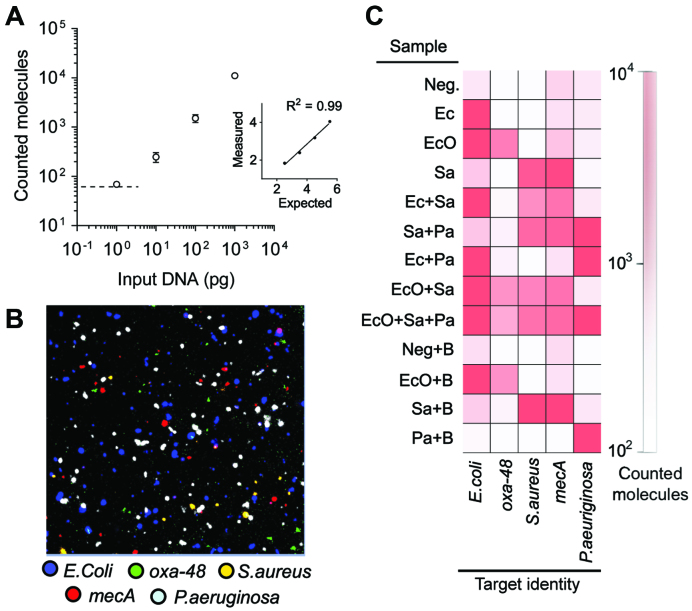
Multiplex quantification of pathogenic bacterial DNA and associated antibiotic resistance markers. (A) Dilutions of S. aureus genomic DNA were subjected to padlock probe ligation, RCA, specific RCP labelling and microfluidic RCP enrichment analysis (Error bars ±1 st. dev. of the mean, n = 2). Dashed line illustrates the limit of detection at 61 RCPs (calculated as negative control + 3 st. dev. from the mean). Inset graph shows linear fit of log expected versus log measured molecule count (R2 = 0.99). (B) Representative region of an image after enrichment of processed sample mix containing E. coli/oxa-48 (EcO), S. aureus/mecA (Sa) and P. aeruginosa (Pa). Fluorescent colour code representing the different padlock probe DNA targets is depicted under the image. (C) Multiplex pathogen and antibiotic marker detection. RCP counts per sample and padlock probe DNA targets are illustrated as a heat map. Samples with ‘B’ correspond to mixes with added background DNA. For raw RCP counts and additional negative controls see Supplementary Table S6.

