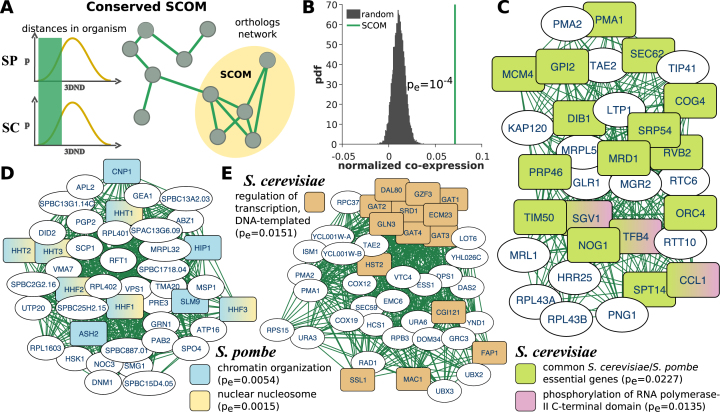
Figure 2.
Conserved SCOMs. (A) Illustration of a conserved SCOM based on S. cerevisiae (SC) and S. pombe (SP) distances. Edges in the network denote pairs of families that have similar distances (bottom-k) in both organisms. (B) Normalized coefficient of co-expression between conserved SCOM genes is significantly higher compared with co-expression in random SCOMs (permuted genomes, empirical P-value). (C–E) Examples for conserved SCOMs. Nodes are genes, and interactions were transformed from the conserved network of orthologous families (the gene lists / details appear in Supplementary Table S1). Significant functions are highlighted. Additional modules appear in Supplementary Figure S5.

