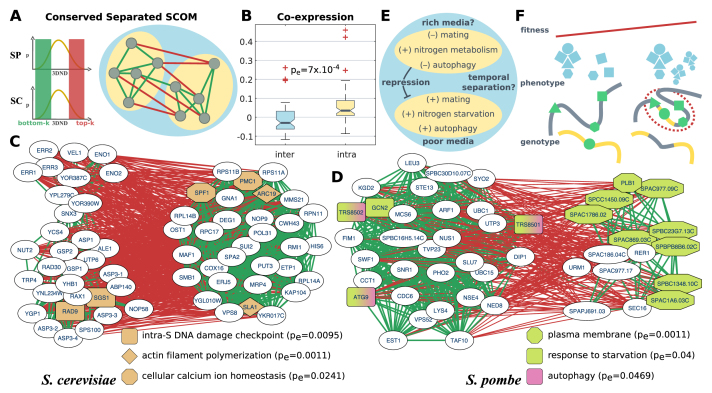
Figure 5.
Conserved separated SCOMs. (A) Illustration of a conserved separated SCOM. Edges in the network denote pairs of families that are either conserved and co-localized (bottom-k, green) or conserved and dispersed (top-k, red) in both organisms. (B) Comparison of the normalized co-expression coefficient within separated submodules versus between separated submodules. Boxplots show the distribution of the average value across organisms (empirical sign-rank P-value). (C–D) Examples for conserved separated SCOMs. Green edges denote conserved co-localization, while red edges denote conserved large distance (separation) between families. Significantly enriched functions are highlighted. (E) A diagram of known positive and inverse relations between biological processes and genes within the submodules of the separated SCOM in panel (D), along with hypotheses for the functionality of their separation. (F) Illustration of a hypothesized emerging SCOM. left: a new protein complex (blue), composed of genes (green) distributed across the genome (on the gray/yellow chromosomes), is formed and gives rise to new functionality. Due to limited regulation on the expression of the genes and the ratio between their products, the efficiency of complex formation is low. right: genome rearrangement (between yellow/gray chromosomes), as well as changes to the conformation of the chromosome, lead to co-localization of the genes, to tighter regulation on their co-expression and to an increase in the organism fitness (red trend line), thus promoting the formation of a new SCOM (red circle).

