Figure 4.
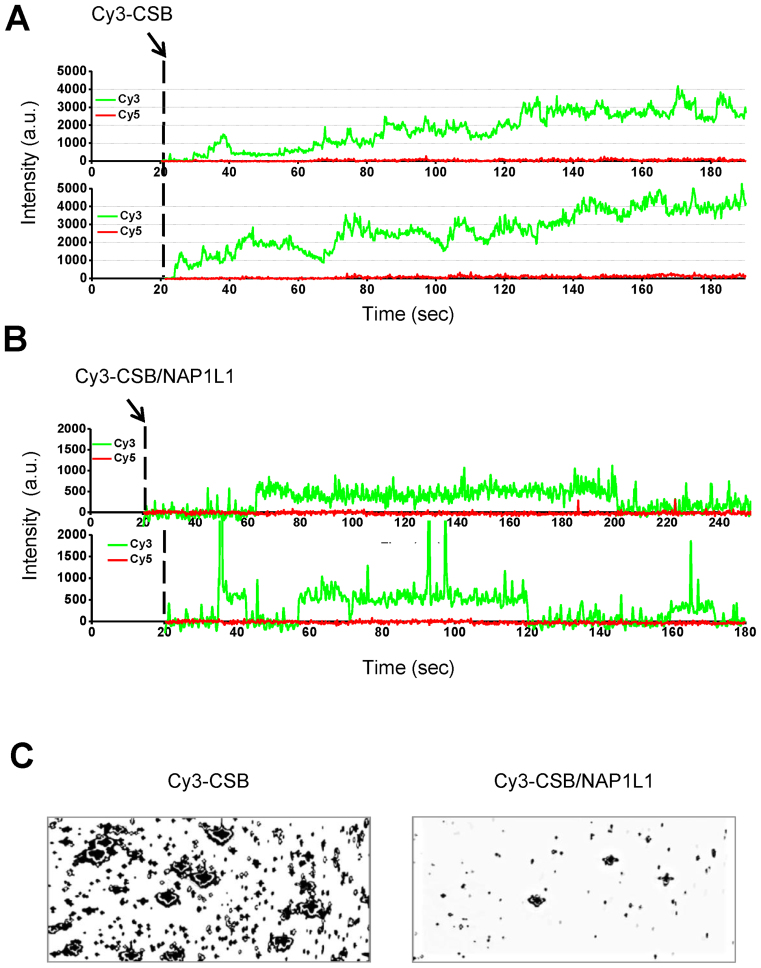
Direct visualization of CSB–DNA complexes. A 228-bp DNA fragment was end-labeled with Cy5 and immobilized to biotinylated PEG using streptavidin. Cy3-labeled CSB was then injected into the detection chamber and binding events were imaged. (A) Representative time traces of Cy3 fluorescence intensity after injection of Cy3-labeled CSB at 20 s (dashed line). In the experimental condition, the fluorescence intensity of a single Cy3 dye was about 250–300 a.u. (B) Representative time traces of Cy3 fluorescence intensity after injection of Cy3-labeled CSB and unlabeled NAP1L1 at 20 s (dashed line). (C) Fluorescence images of Cy3–CSB bound to DNA in the absence (left) or presence (right) of NAP1L1. Unbound proteins were washed out of the detection chamber before imaging.

