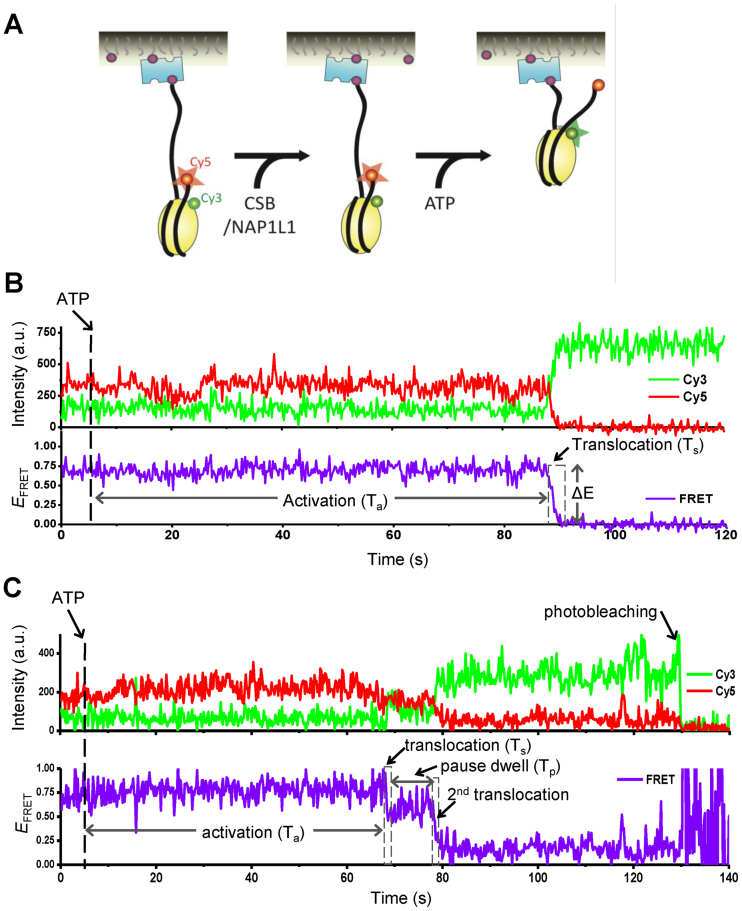
Figure 5.
Nucleosome remodeling by CSB and NAP1L1 revealed by single-molecule FRET. (A) Single molecule measurement scheme for nucleosome remodeling by CSB and NAP1L1. The nucleosome had a 3 bp linker on the exit side and a 78 bp linker on the entry side. The nucleosome was labeled with a FRET donor (Cy3, green) on histone H2A (residue 120) and a FRET acceptor (Cy5, red) on the exit side of the DNA. FRET is observed when the donor and acceptor are close together (large red star). An increase in the distance between the FRET probes will result in a decrease in FRET intensity (small red circle). (B and C) Representative fluorescence intensity and corresponding FRET traces displaying nucleosome remodeling by 75 nM CSB and 300 nM NAP1L1. ATP (1 mM) was added into the detection chamber at 5 seconds (dashed line). (B) Remodeling without a pause. Activation time (Ta) indicates the time lapse between ATP injection and the first decrease in the FRET efficiency. The translocation time (Ts) indicates the duration of the first decrease in FRET efficiency (dashed box). (C) Remodeling with a pause. The pause dwell time (Tp) indicates the lifetime of the lower FRET state after the first decrease in FRET efficiency. Ta and Ts are defined as in (B).

