Figure 6.
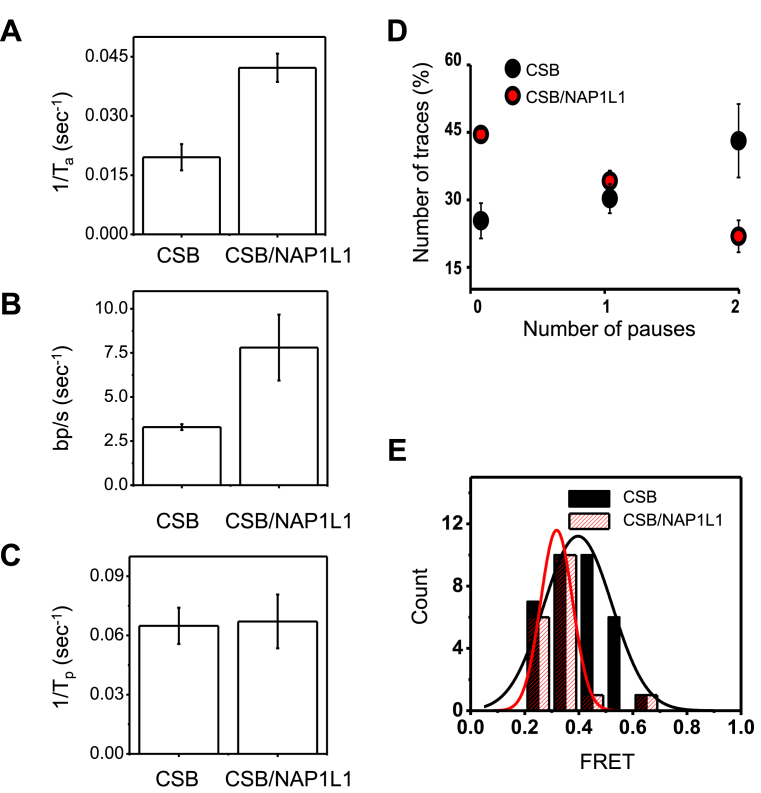
Comparison of chromatin remodeling by CSB in the presence and absence of NAP1L1. (A and B) Quantification of nucleosome remodeling parameters using 75 nM CSB alone or in the presence of 300 nM NAP1L1 and 1 mM ATP. The rates were obtained from the data shown in Supplementary Figures S8. Error bars indicate curve-fitting errors. (A) Rate constants of activation (1/Ta, where Ta is the time required for the first FRET change). One-sample t-tests with equal variance yielded a P-value of 0.004. (B) Translocation rate. To obtain the translocation rate, calibration data in Supplementary Figure S9 were used to convert the FRET change (ΔE) for the first remodeling event to the translocation length, which was then divided by the time duration of the FRET change (Ts). One-sample t-tests with equal variance yielded a P-value of 0.003. (C) The pause dwell time (Tp), which indicates the lifetime of the lower FRET state after the first translocation. One-sample t-tests with equal variance yielded a P-value of 0.6. (D) Pause frequency. Shown are means ± SEM (n = 58 for CSB and n = 61 for CSB/NAP1L1). (E) The distribution of FRET values during the first nucleosome translocation. The data were fit to a single Gaussian function. The resulting center FRET values for CSB and CSB/NAP1 were determined to be 0.4 and 0.3 with standard deviations of 0.32 and 0.14, respectively.

