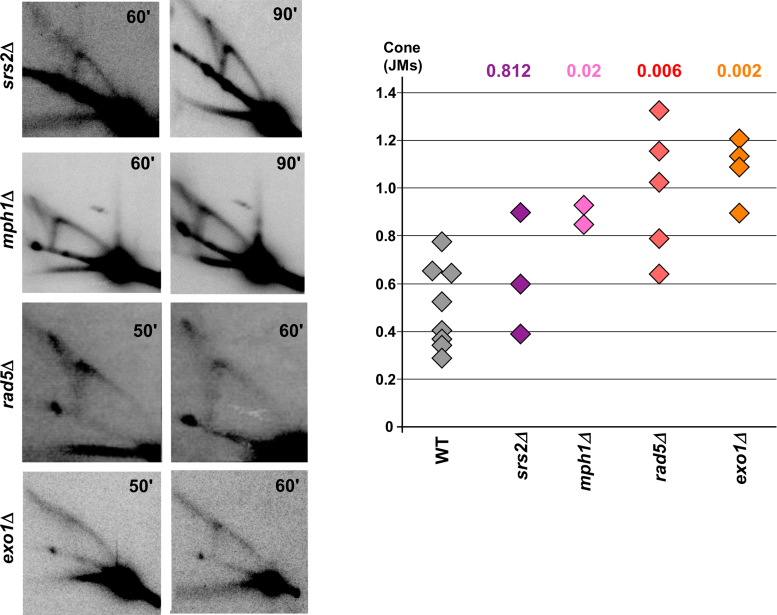
Figure 4.
Representative 2D gels for srs2Δ, mph1Δ, rad5Δ and exo1Δ strains. Times at which cells were collected after alpha-factor release are indicated in the top right corner of each gel. Quantifications of the ratio of cone (JMs) over Y arc signals are shown on the accompanying graph; P values compared to wild-type (Mann–Whitney Wilcoxon rank test) are listed above the respective mutant and in Supplementary Table S4.

