Figure 3.
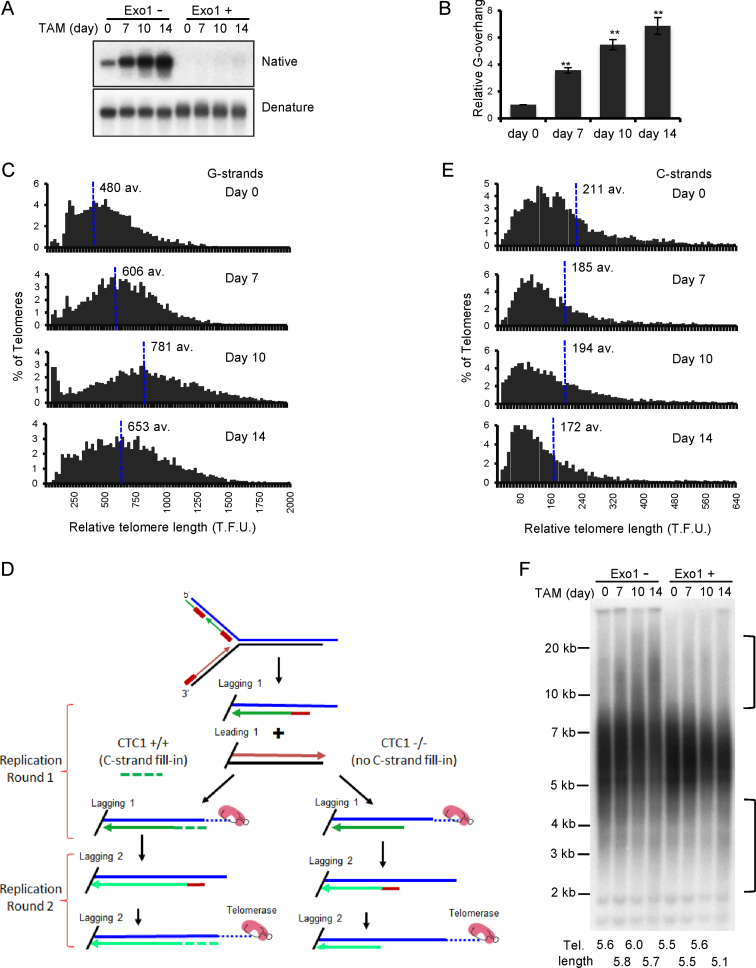
Effect of CTC1 disruption on G-overhang structure and telomere length. CTC1 conditional cells were treated with/without tamoxifen (TAM) for the indicated times. (A and B) Analysis of G-overhang abundance by in-gel hybridization. (A) Gel showing hybridization of TAA(C3TA2)3 probe to genomic DNA under native and denaturing conditions. (B) Quantification of relative G-overhang abundance. Overhang abundance in CTC1−/− cells was normalized to that of CTC1F/F cells (i.e. t = 0). Mean ± S.E.M., n = 3 independent experiments. (C) Analysis of telomere length by FISH. Metaphase spreads were hybridized with (C3TA2)3 telomere G-strand probe and the signal intensity was quantified. Histograms show the distribution of relative telomere lengths expressed as fluorescence intensity (TFU, telomere fluorescence unit), av.; median value, >2000 telomeres were quantified for each sample. A minimum intensity of 100 TFU was set as the cut-off. (D) Cartoon illustrating how loss of C-strand fill-in leads to shortening of lagging strand telomeres following each round of replication. (E) Analysis of telomere length by FISH as in (C) except probe was (G3T2A)3. (F) Southern blot showing length of telomere restriction fragments. Exo1+, DNA was treated with Exo1 prior to restriction digestion. Probe was TAA(C3TA2)3. Brackets indicate telomere that appear to have undergone elongation or shortening. Mean telomere length is indicated below each lane.

