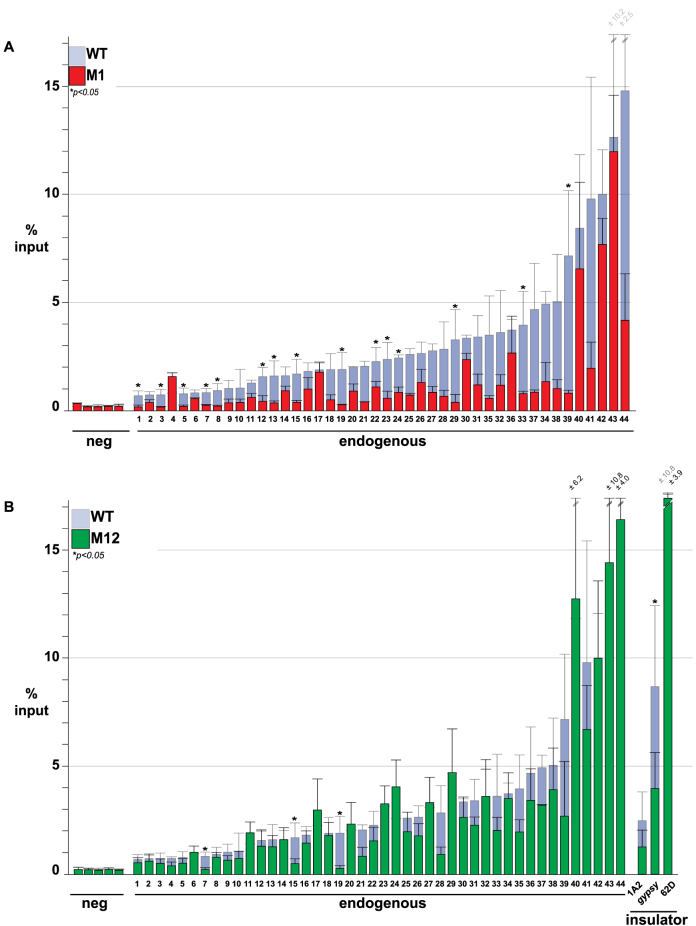
Figure 5.
Analysis of Su(Hw)M1 and Su(Hw)M12 association at endogenous SBSs. (A) Shown are ChIP-qPCR data for Su(Hw)WT (light gray), Su(Hw)M1 (red) and Su(Hw)M12 (green) at genomic regions lacking an SBS (5 negative control sites), carrying an SBS (44 endogenous sites) and known insulators (1A2, 62D, gypsy). Data for Su(Hw)M1 and Su(Hw)M12 are graphed on top of the Su(Hw)WT data for comparison. Data represent average percent input of two-four biological replicates. Error bars indicate standard deviation. P < 0.05 (Student's t-test).

