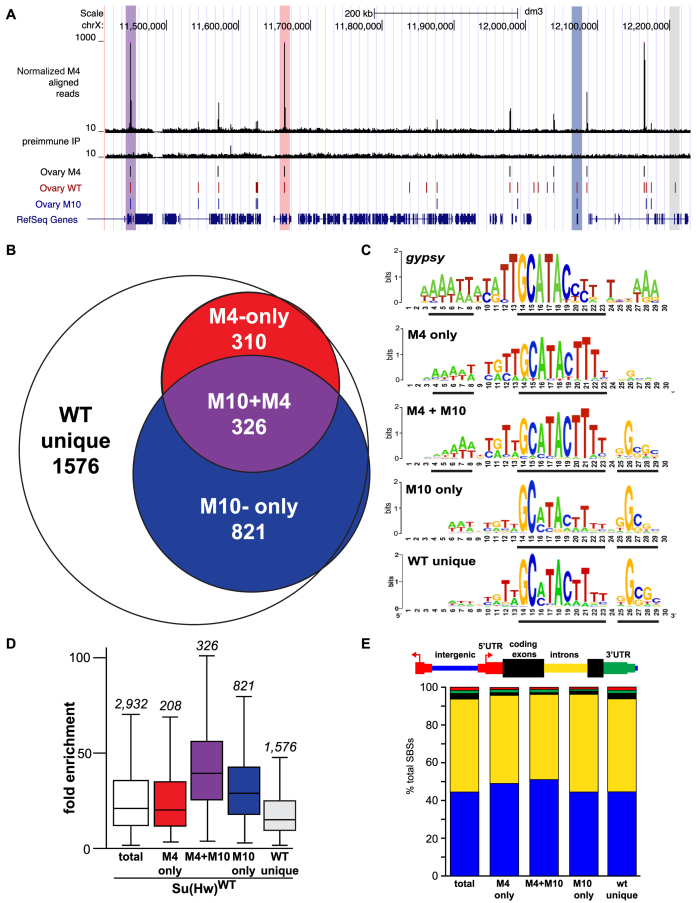
Figure 6.
Su(Hw)M4 localizes to a subset of endogenous SBSs. (A) Shown is a UCSC Genome Browser view of a region of chromosome X with the ChIP-seq track obtained for Su(Hw)M4. Tracks include Su(Hw)M4 aligned reads, pre-immune IP control reads, called peaks from the Su(Hw)M4, Su(Hw)WT and Su(Hw)M10 ovary datasets (31) and RefSeq genes. Highlighted are peaks that represent an overlap of Su(Hw)M4, Su(Hw)WT and Su(Hw)M10 (purple); an overlap of Su(Hw)M4 and Su(Hw)WT (red); an overlap of Su(Hw)WT and Su(Hw)M10 (blue); or no overlap with Su(Hw)M4 or Su(Hw)M10 (WT unique, gray). (B) Venn diagram depicting the overlap between Su(Hw)WT, Su(Hw)M10 and Su(Hw)M4 SBSs. The number of SBSs in each category is listed. (C) MEME-generated sequence logo for the gypsy insulator and SBS classes including M4-only, M4+M10, M10-only and WT unique. The black lines beneath each logo identify the most conserved cores in each motif. (D) Shown is a graph of ChIP-seq fold enrichment for SBSs in the following categories: total [white box; (31)], M4-only (red), M4+M10 (purple), M10-only (blue) and WT unique (gray). Each box represents the 25th to 75th percentile interval, with the median enrichment indicated by the line. Whiskers represent the non-outlier range. The total number of SBSs in each class is shown above the box plot. (E) Shown is the genomic distribution of total SBSs and SBS classes relative to gene features including intergenic regions (blue), introns (yellow), coding exons (black), 5΄ UTRs (red) and 3΄ UTRs (green).

