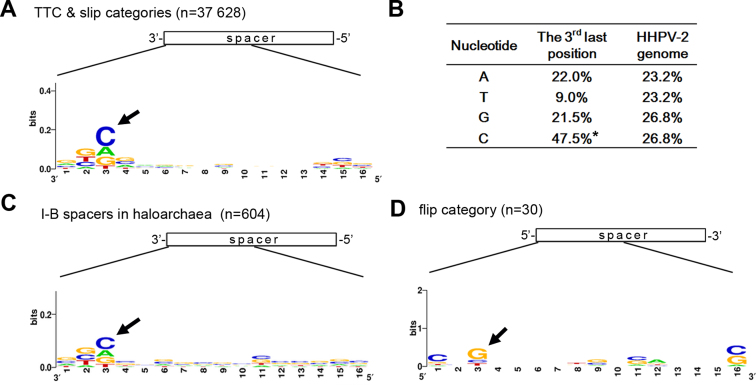
Figure 5.
Nucleotide preference at the spacer 3΄-end. (A) Nucleotide conservation at the 3΄-end of the 37 628 spacers from the ‘TTC’ and the ‘slip’ categories. (B) The frequency of A/T/G/C at the third last position of the ‘TTC’ and ‘slip’ category spacers, which significantly differs from the nucleotide composition of the HHPV-2 genome. Note that the cytosine bias (indicated by an asterisk) at the third last position is significant (P < 0.001, χ2 test). (C) Nucleotide preference at the 3΄-end of 602 haloarchaeal spacers that were collected from the CRISPRdb database (Supplementary Figure S2). (D) Nucleotide conservation at the 5΄-end of the 30 ‘flip’ category spacers. Numbers along the X axis indicate positions with respect to the spacer 3΄-end (in panels A and C) or 5΄-end (in panel D). Black arrows indicate the preferred nucleotides.

