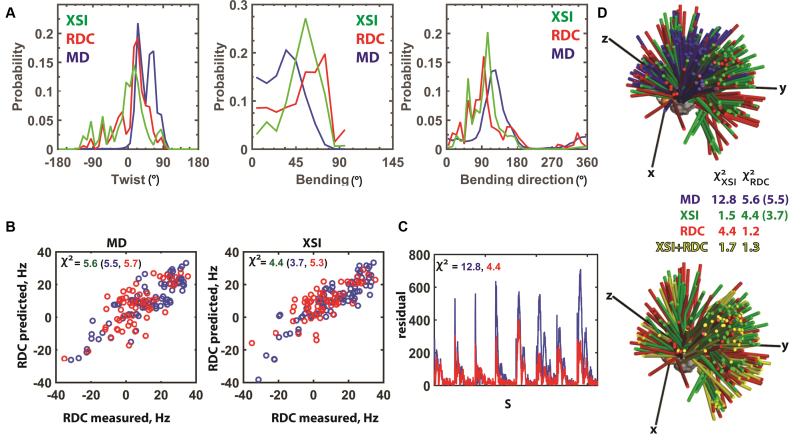
Figure 4.
Comparison of XSI- and RDC-derived TAR RNA ensembles. (A) XSI (green) and RDC (5) (red) TAR ensembles under similar low salt conditions (XSI: 10 mM sodium ascorbate and 30 mM Tris.HCl, pH 7.4 and 10 mM NaCl; RDC: 15 mM Na phosphate, pH 6.4, 25 mM NaCl, 0.1 mM EDTA) and the MD-derived ensemble (5) (blue) (See Supplementary Figure S19 for translational information). (B) Comparison of measured RDC values with RDC values predicted from the MD-derived ensemble (left) and from the XSI-derived ensemble (right). The χ2 values were calculated as the average of (RDCcalculated – RDCmeasured)2/ RDCerror2 for RDC values of all residues (green), of the residues in the flanking helices (blue) and of the residues in the bulge region including the CUC bulge and the two base pairs 5΄ to the bulge (red). (C) Comparison of the residuals between the measured XSI and XSI predicted from the MD-derived ensemble (5) (blue) and XSI predicted from the RDC-derived ensemble (5) (red) for each of the eight Au–Au pairs (Figure 2B). The χ2 values were calculated as the average of (XSIcalculated – XSImeasured)2/ XSIerror2. (D) Three-dimensional representation of the TAR ensembles derived from MD (5) (blue), XSI (green), RDC (5), (red) and a combination of XSI and RDC (yellow). The colored sticks represent the position of the long axes of the top helix (see Figure 3A), and each stick represents 1% of the total population. The χ2 values were determined as described in part B and C; RDC χ2 values are for all residues and, in parenthesis, for the flanking helices.

