. 2017 Mar 1;8(5):3390–3398. doi: 10.1039/c7sc00441a

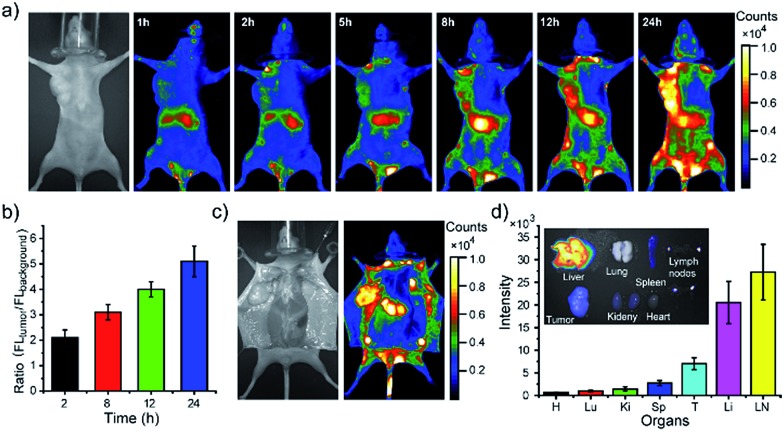
Fig. 5. Simultaneous tumor imaging and lymph-node imaging of MCF-7 tumor-bearing nude mice with PEG-NIR Pdots. (a) Fluorescent images of mouse injected with PEG-NIR Pdots collected at designated time points. (b) Fluorescent signal ratio of tumor to background during 24 hour after Pdots injection. (c) Bright-field and fluorescent images of the same mouse opening of abdomen skin 24 hours post Pdot injection. (d) Quantitative fluorescence analysis of the Pdots in liver, lung, spleen, kidney, heart, tumor and lymph nodes (n = 3). Inset shows the overlap image of fluorescence image and bright-field image of liver, lung, spleen, kidney, heart, tumor and lymph nodes.

Fig. 5