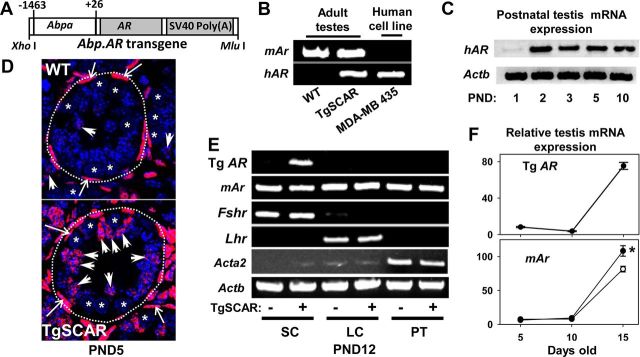
Fig. 1.
Detection of Tg human AR in TgSCAR-3 mice. A, The Tg DNA construct consisted of the human AR cDNA (AR) sequence flanked by the rat Abpa P1 promoter and simian virus 40 (SV40) polyadenylation signal sequence, as described in Materials and Methods. B, Species-specific detection of Tg human AR (hAR) or endogenous mouse Ar (mAr) mRNA in WT or TgSCAR-3 adult mouse testes by RT-PCR, using the AR-expressing human MDA-MB-435 cell line as control. C, Postnatal onset of testicular Tg hAR mRNA expression detected as early as PND2 in TgSCAR-3 mice by RT-PCR, using Actb as sample control. D, Anti-AR antibody detection by immunofluorescent microscopy using testis sections from PND5 TgSCAR-3 and WT mice. Anti-AR staining (pink-red; green to red pseudocoloring used for Alexa Fluor 488) overlapped with DAPI-labeled nuclei (blue). Strong AR staining was clearly detected in the irregular columnar shaped SC nuclei (some highlighted by large arrowheads) of TgSCAR testes, contrasting with sparse staining in WT testes. Strong peritubular expression of AR (long arrows) was found in WT and TgSCAR testes. Dashed circular lines highlight circumference of seminiferous tubules. Germ cells (asterisks) and cytoplasmic regions around DAPI-stained nuclei were devoid of AR. Shown at same magnification (original ×100). E, Testicular primary somatic AR-expressing cells were enriched from PND12 TgSCAR (+) and non-Tg WT littermate (−) testes using trypsin-collagenase digestion as described in Materials and Methods. TgSCAR mRNA was detected in enriched SC, but not Leydig cell (LC) and peritubular cell (PC), preparations by RT-PCR, demonstrating Sertoli-specific expression, unlike the mouse Ar mRNA found in all cell preparations. F, top, Relative testicular levels of Tg human AR mRNA increased with age in postnatal TgSCAR mice. Bottom, Endogenous mouse Ar increased with age and was significantly higher in PND15 TgSCAR (solid circle) vs. WT (open circle) testes. Values are mean ± sem (n = 6–10/group). *, P < 0.05.

