Fig. 5.
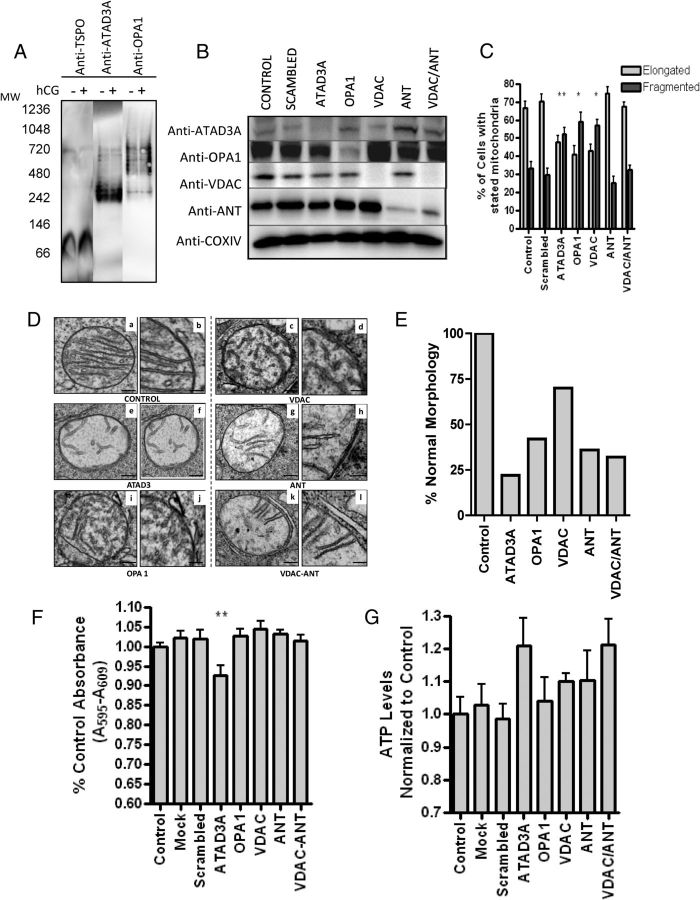
Effect of ATAD3A, VDAC, OPA1, and ANT knockdown on MA-10 mitochondrial morphology. A, BN-PAGE immunoblot identifies TSPO, OPA1, and ATAD3A at the 800-kDa molecular mass complex. B, MA-10 cells were transfected with the siRNA targeted for the indicated gene products. After 3 d of treatment, specific protein expression was assessed by immunoblot analysis. Immunoblots shown are representative of three independent experiments. C, The percent elongated vs. tubular mitochondria of the mitochondria treated with stated siRNA as indicated in panel B. One-way ANOVA with Dunnett's Multiple Comparison Test on the difference in percent elongated was performed. Results shown are means ± sem (n = 2; 200 cells scored each); *, P < 0.05, **, P < 0.01. D, Transmission EM images of MA-10 cells treated with or without mitochondrial protein-specific siRNAs. a, c, e, g, I, and k are low magnification images (200 nm) whereas b, d, f, h, j, and i are higher magnification images (100 nm) of representative mitochondria from cells treated as indicated under each panel. E, Quantitative evaluation of altered mitochondrial morphology in response to the various siRNA treatments obtained as described under Materials and Methods. Values are reported as percentage of normal mitochondria relative to control; control, scrambled, and mock have the same percentage of transfection. F, MTT analysis compared with control (%) and (G) ATP levels normalized to control in siRNA-treated cells. Samples are ± sem (n = 2; each point in triplicate); **, P < 0.01.

