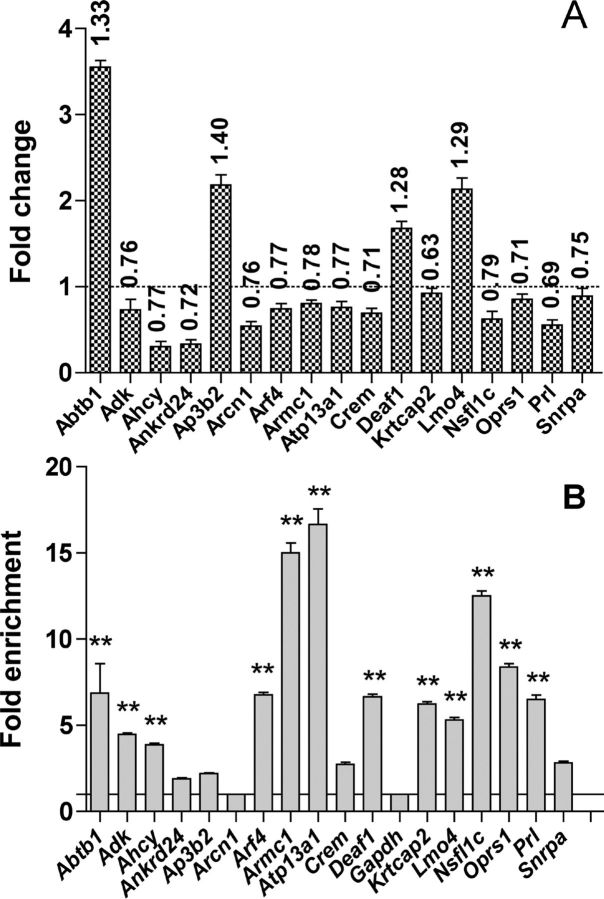
Fig. 1.
A, Effect of POU1F1(R271W) on the expression of 17 genes of the 121 potential direct targets in GH4C1 cell line. Total RNA was prepared from GH4C1 cells using a NucleoSpin RNAII kit (Macherey-Nagel), and reverse transcription was performed followed by qPCR. Results were calculated using the ΔΔCt method (29), in which Gapdh was chosen as normalizer because, as evidenced in the microarray data, its level was not affected by the expression of the POU1F1(R271W). The graph represents the fold change in gene expression (n = 3 biological replicates). Numbers above the bars represent the fold change obtained previously in the microarray experiment. Prl was used as positive control. The sequences of the primers used can be found in Supplemental Table 9. Note that the primers used for Crem on this figure detect the ICER isoform of this gene. B, Recruitment of POU1F1 to the promoter of the same 17 genes. ChIP-qPCR was performed using mouse pituitaries and POU1F1 antibody. Gapdh and Prl were used, respectively, as negative and positive controls (n = 3 biological replicates). The sequences of the primers used can be found in Supplemental Table 9. Results were calculated using the fold enrichment method (30). The ΔCt {ΔCt = Ct sample − Ct input} then the ΔΔCt were calculated [ΔΔCt = ΔCt (immune serum) − ΔCt (nonimmune serum)]. The fold difference between experimental sample (immune serum) and negative control (nonimmune serum) was obtained using 2(−ΔΔCt). Statistically significant differences were determined using Dunnett's multiple comparison tests, and data are expressed as means ± se (*, P < 0.05; **, P < 0.01).

