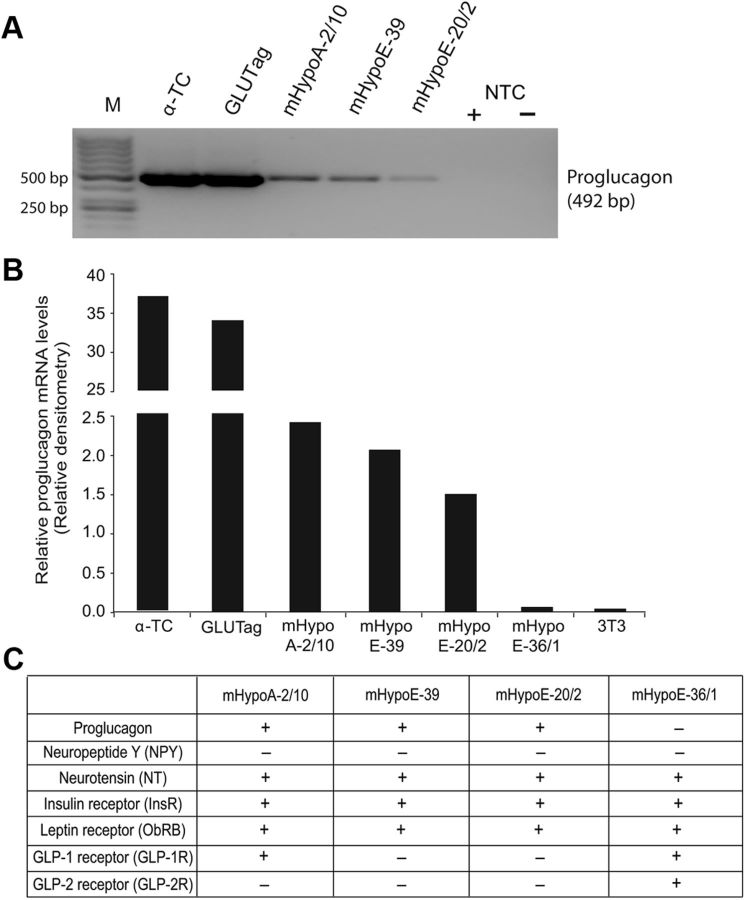
Fig. 1.
Characterization of the expression profile of the proglucagon-expressing hypothalamic cell lines. Expression of proglucagon mRNA transcripts in pancreatic α-TC cells; intestinal GLUTag cells; hypothalamic neuroendocrine cell lines mHypoA-2/10, mHypoE-39, mHypoE-20/2, and mhypoE-36/1; and fibroblast 3T3 cells. A, RT-PCR using specific primers for mouse proglucagon and γ-actin genes. Total RNA was isolated from the indicated cell lines and used as template for RT-PCR using the One-Step RT-PCR kit (QIAGEN). M, Markers; NTC, nontemplate control (± reverse transcriptase). B, Graphical representation of relative proglucagon mRNA transcripts levels quantified by densitometry. Proglucagon mRNA values were normalized to γ-actin levels. C, RT-PCR analysis results for the mRNA expression of neuropeptides and receptors in the indicated hypothalamic cells. + indicates that the gene is expressed, and − indicates that the gene is weakly expressed or not expressed.

