
Fig. 6.
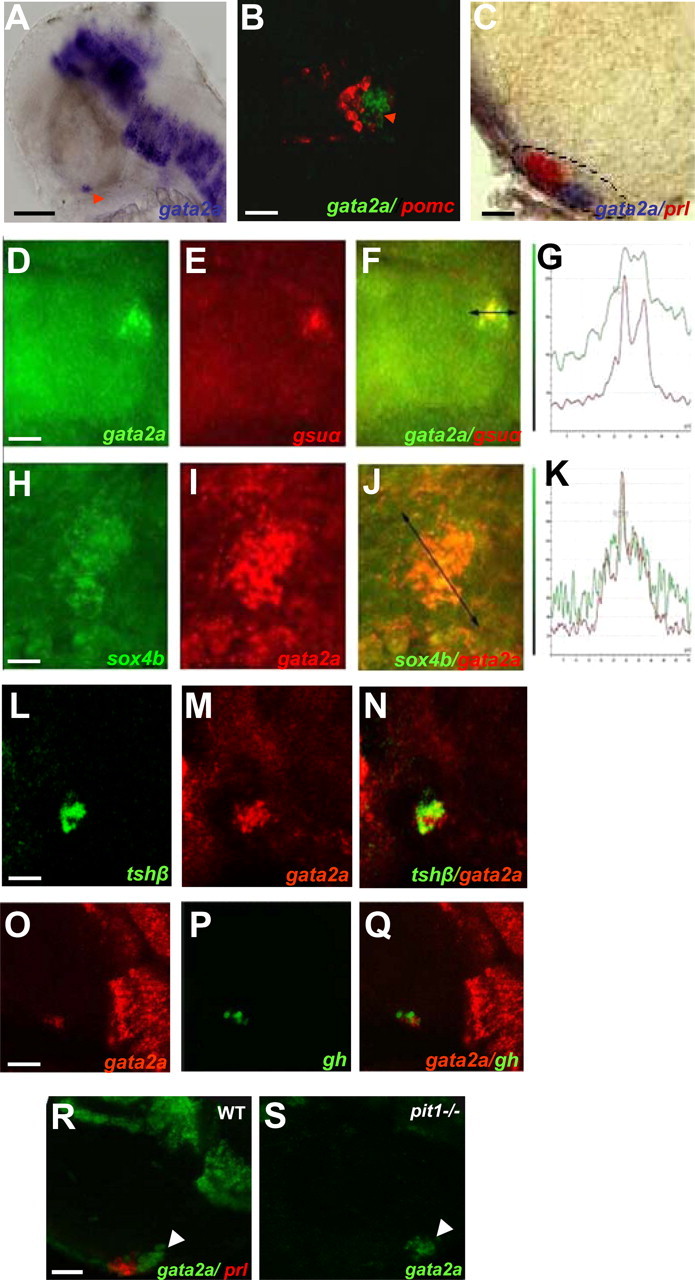
gata2a mRNA is detected in sox4b- and gsuα-expressing cells in 48-hpf embryos. WISH was performed on wt zebrafish embryos using the gata2a antisense probe. A and C, Lateral view (anterior to the left); B, ventral view (anterior to the top). Scale bars, 100 μm (A), 45 μm (B), and 40 μm (C). Arrowhead in A points at gata2a expression in the pituitary. A, Single-probe gata2a (blue); B, double-fluorescent WISH showing gata2a (green) and pomc (red) mRNA (z-plane confocal image); C, double WISH showing gata2a (blue) and prl (red) mRNA; the ventral head regions were dissected before microscopy. D–N, Double-fluorescent WISH showing coexpression as follows: D-G, of gata2a (green, D) and gsuα (red, E); F, overlay of D and E; G, fluorescence emission quantification in F. H-K, sox4b (green, H) and gata2a (red, I); J, overlay of H and I; K, fluorescence emission quantification in J. L–N, tshβ (green, L) and gata2a (red, M); N, overlay of tshβ and gata2a expression; D–N, z-plane confocal image, ventral views (anterior to the left). O–Q, Z-plane of the confocal images, lateral view (anterior to the left); gata2a (red, O) and gh (green, P); Q, overlay of gata2a and gh expression. R and S, gata2a expression in wt and pit1 mutants (pit1-/-) are shown in upper right corner in embryos at 48 hpf. Analysis by double-fluorescent WISH, lateral view (anterior to the left), one Z-plane of the confocal images is shown; gata2a (green, R and S) and prl (red, R) is shown, the arrowhead points to gata2a expression in the pituitary (R and S). Scale bars, 40 μm (D–F, L–N, R, and S), 20 μm (H–J), and 60 μm (O–Q).