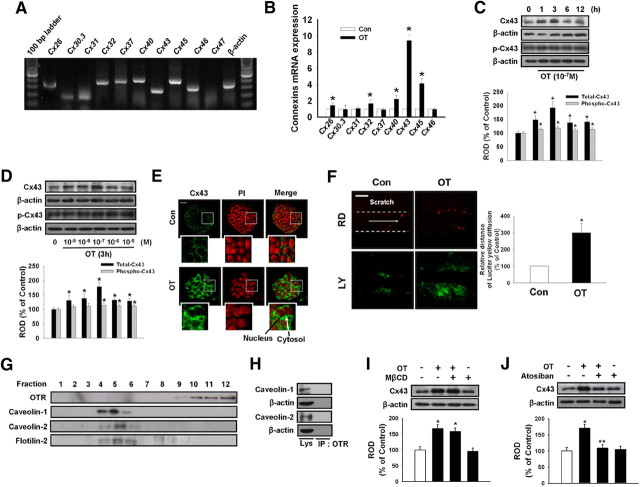
Fig. 2.
OT increases Cx43 expression via lipid raft-independent OTR. A, Total RNA from mouse ESC was reverse transcribed, and connexin family members cDNA was amplified by PCR as described in Materials and Methods. Each example shown is representative of five independent experiments. B, Cells were treated with 10−7 m OT for 3 h. The mRNA expression of connexin family members was measured in cells using real-time PCR as described in Materials and Methods. The data is reported as the mean ± se of four independent experiments, each conducted in triplicate. *, P < 0.05 vs. control. Time (C) and dose (D) responses of OT on Cx43 protein expression levels: Mouse ESC were treated with OT for various times (0–12 h) or different doses of OT (0–10−5 m) for 3 h and then harvested. Total protein was extracted and blotted with antibody against total Cx43 and phospho-Cx43. Each of the examples shown is representative of five independent experiments. The lower part (C and D) depicting the bars denotes the mean ± se of five independent experiments for each condition determined from densitometry relative to β-actin. *, P < 0.05 vs. control. E, Mouse ESC were incubated with OT for 3 h, and Cx43 was detected by immunostaining with anti-Cx43 antibody counterstained with PI. Insets show magnified versions of the sections in the white boxes. Scale bars, 20 μm (magnification, ×400). F, Mouse ESC treated with OT (10−7 m) for 3 h and GJIC analysis was carried out using a SL/DT assay, as described in Materials and Methods. The right panel depicts the mean ± sd of five independent experiments for each condition as determined from quantification of GJIC (the relative distance of LY diffusion compared with control). *, P < 0.05 vs. control. Scale bars, 20 μm (magnification, ×400). G, Control lysate was subjected to discontinuous sucrose density gradient fractionation, after which OTR, caveolin (cav)-1, cav-2, and flotilin-2 were detected. Each fraction was assessed by Western blot. H, Normal mouse ESC lysates were analyzed by Western blotting with antibodies that recognize OTR, cav-1, and cav-2. Immunoprecipitation of anti-OTR was analyzed by Western blotting with antibodies that recognize cav-1 and cav-2. Each of the examples is representative of five independent experiments. I, Cells were pretreated with lipid raft disruptor MβCD (10−4 m) for 30 min before OT (10−7 m) treatment for 3 h. Total protein was extracted and blotted with Cx43 or β-actin antibodies. Each example shown is representative of five independent experiments. J, Cells were pretreated with the OTR inhibitor atosiban (10−5 m) for 30 min before OT treatment for 3 h. Total protein was extracted and blotted with Cx43 or β-actin antibodies. Each example shown is a representative of five independent experiments. The lower part (H–J) depicting the bars denotes the mean ± se of five independent experiments for each condition determined from densitometry relative to β-actin. *, P < 0.05 vs. control, **, P < 0.05 vs. OT alone. Con, Control; IP, immunoprecipitation; ROD, Relative Optical Density.

