Fig. 3.
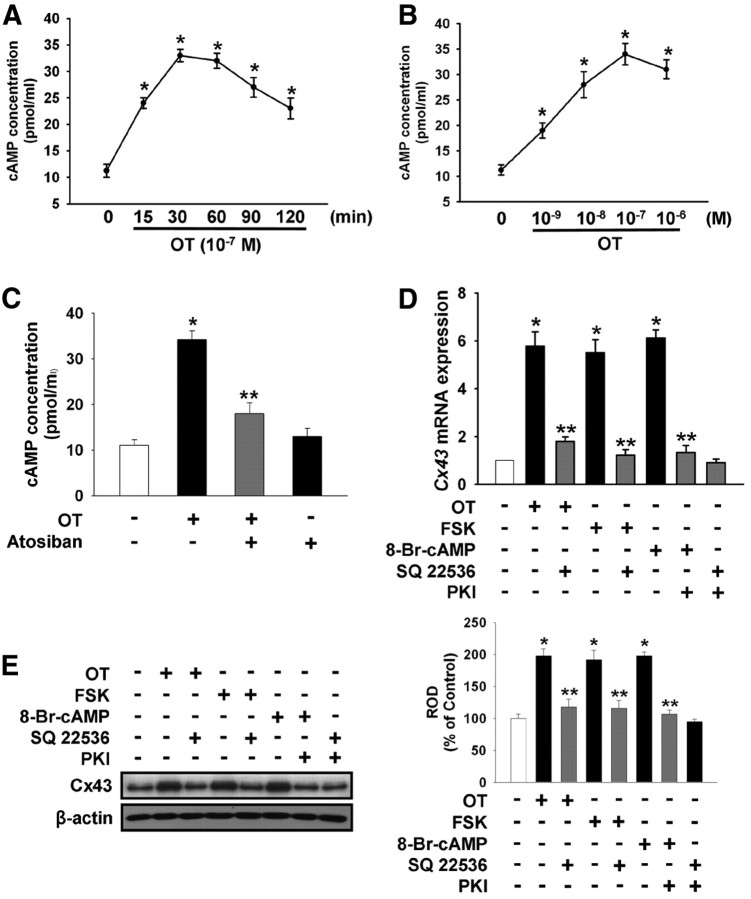
OT elevate intracellular cAMP levels. Time (A) and dose (B) response of OT on intracellular cAMP levels. Mouse ESC were treated with OT for various times (0–120 min) or with different doses of OT (0–10−6 m) for 30 min. The maximum increase in intracellular cAMP levels was observed after a 30-min incubation with 10−7 m OT. The values represent the mean ± se of four independent experiments with triplicate dishes. *, P < 0.05 vs. control. C, Cells were pretreated with atosiban (10−5 m) for 30 min before OT treatment for 30 min. The values represent the mean ± se of four independent experiments with triplicate dishes. *, P < 0.05 vs. control; **, P < 0.05 vs. OT alone. D, Real-time RT-PCR quantification of the Cx43 gene. Cells were pretreated with adenylyl cyclase inhibitor SQ 22536 (10−5 m) or/and PKA inhibitor PKI (4 × 10⁻⁵ m) for 30 min before the adenylate cyclase activator FSK (10−5 m), the membrane-permeable cAMP analog 8-Br-cAMP (2x10⁻³ m), or OT (10−7 m) treatment for 3 h. Total RNA from mouse ESC was reverse-transcribed, and Cx43 cDNA was amplified by real-time PCR as described in Materials and Methods. The data are reported as the mean ± se of four independent experiments, each conducted in triplicate. *, P < 0.05 vs. control; **, P < 0.05 vs. OT alone. E, Cells were pretreated with SQ 22536 or/and PKI (4 × 10⁻⁵ m) for 30 min before FSK (10−5 m), 8-Br-cAMP (2 × 10⁻³ m), or OT (10−7 m) treatment for 3 h. Total protein was extracted and blotted with Cx43 or β-actin antibodies. Each example shown is representative of five independent experiments. The right part (E) depicting the bars denotes the mean ± se of five independent experiments for each condition determined from densitometry relative to β-actin. *, P < 0.05 vs. control; **, P < 0.05 vs. OT alone; ROD, Relative Optical Density.

