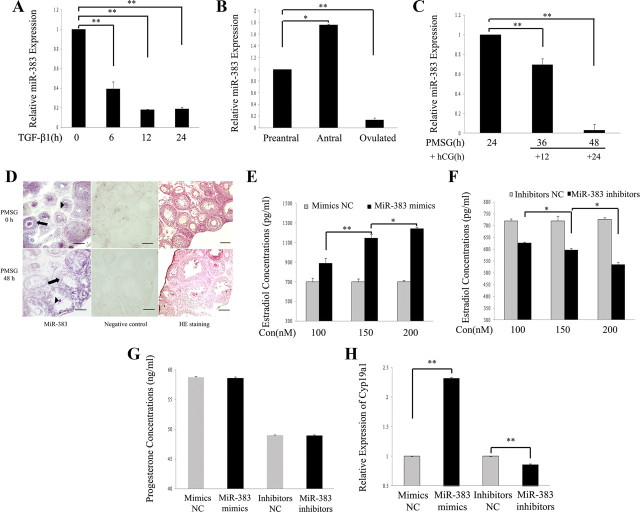
Fig. 1.
miR-383 promotes E2 synthesis in mouse ovarian GC. A, TGF-β1 suppressed miR-383 expression in GC. mGC were treated with TGF-β1 (5 ng/ml) for 6, 12, and 24 h and subjected to real-time PCR analysis. B, miR-383 expression levels in preantral, antral, and ovulated follicles. Total RNA was extracted from follicles at different stages and then subjected to real-time PCR. Data obtained from the preantral follicles were arbitrarily set at 1.0. C, Changes in miR-383 expression in ovaries of PMSG/hCG-treated immature mice. Total RNA was extracted from ovaries of PMSG-treated mice at 24 h and PMSG/hCG-treated mice at indicated post-hCG time points and then subjected to real-time PCR. D, miR-383 is mainly localized in GC (arrow) and oocytes (arrowhead) of ovarian follicles at various developmental stages. miR-383 expression was performed on 10-μm frozen ovarian sections by ISH using LNA-modified DNA probe complementary to miR-383. Left panel, Positive ISH signals (purple) of miR-383. Middle panel, NC of ISH (nonspecific LNA-modified DNA oligonucleotide). Right panel, Hematoxylin and eosin (HE) staining of mouse ovarian tissues. Scale bar, 100 μm. E and F, Overexpression and knockdown of miR-383 significantly stimulated and inhibited, respectively, E2 release from GC in a dose-dependent manner. GC were transfected with different concentrations (100, 150, and 200 nm) of miR-383 mimics and mimics NC, or of miR-383 inhibitors and inhibitors NC for 48 h. After culture, media were collected for measurement of E2 levels. G, Overexpression and knockdown of miR-383 did not affect progesterone release in GC. Primary GC were transfected with 120 nm each of miR-383 mimics and mimics NC, or 150 nm each of miR-383 inhibitors and inhibitors NC for 48 h. Progesterone levels were evaluated in the medium after 48 h of culture. H, miR-383 mimics enhanced Cyp19a1 mRNA expression, whereas knockdown of endogenous miR-383 suppressed Cyp19a1 mRNA levels in GC. GC were transfected with oligonucleotides for 48 h as described above. Total RNA was extracted from GC, and Cyp19a1 mRNA was analyzed by real-time PCR. In A–C and E–H, data shown represent the mean ± sem of three independent experiments performed in triplicate. *, P < 0.05; **, P < 0.01. Con, Concentration.

