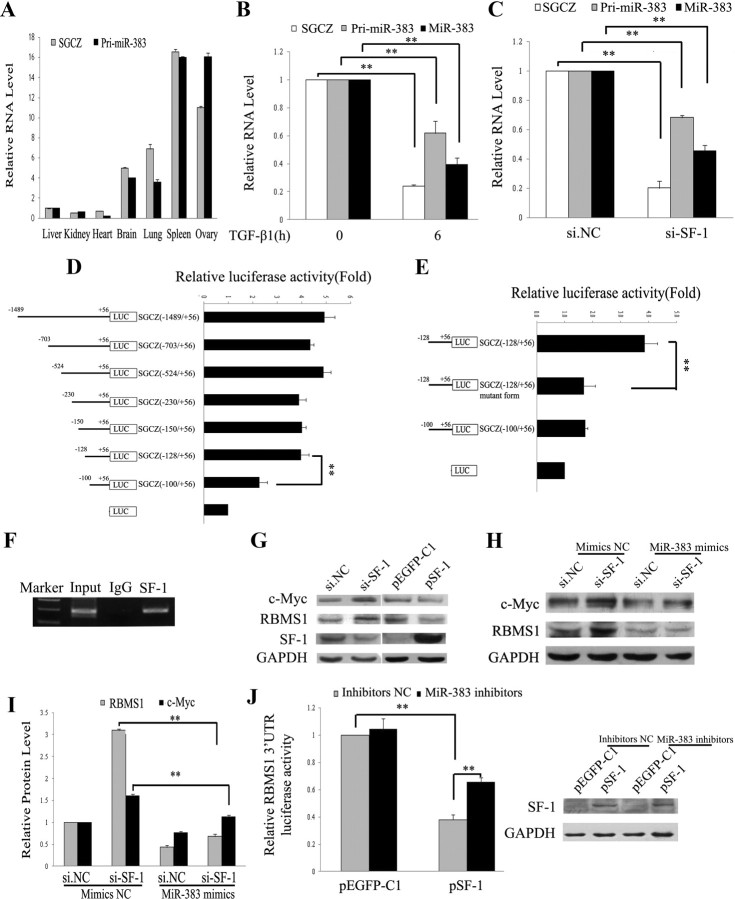
Fig. 4.
SF-1 transactivates miR-383 through direct binding to the promoter of miR-383 host gene SGCZ. A, Expression patterns of SGCZ and pri-miR-383 in different mouse tissues. B, RNA expression levels of SGCZ, pri-miR-383, and miR-383 in TGF-β1-treated GC. C, Knockdown of SF-1 decreased the RNA levels of SGCZ, pri-miR-383, and mature miR-383. GC were transfected with si-SF-1 (30 nm), and the RNA levels was determined after 48 h of transfection by real-time PCR. D, Identification of the minimal promoter region of the mouse SGCZ gene. Left panel, Schematic representation of 5′- or 3′-deleted fragments of the mouse SGCZ promoter in conjunction with the luciferase gene (LUC) in pGL3-Basic vector. The nucleotides are numbered from the transcriptional starting site that was assigned +1. Right panel, Luciferase activity of the deleted promoter constructs. NIH3T3 cells were transfected with serial mouse SGCZ promoter-luciferase reporter deletion constructs. Relative luciferase activity was calculated as a ratio of luciferase activity of the SGCZ deletion constructs driven by SF-1 over the pGL3-Basic empty vector, which was arbitrarily set at 1. E, Mutational analysis of SGCZ promoter-luciferase reporter constructs. Mutated SGCZ promoter constructs (−128/+56) were cloned into the luciferase reporter vector pGL3-Basic. F, ChIP analysis reveals in vivo binding of SF-1 to the SGCZ promoter. ChIP assays were performed on GC extracts using antibodies against IgG and SF-1, followed by PCR amplification with primers sequences corresponding to the mouse SGCZ promoter region between nucleotides −200 and −8. G, Western blot analysis of the effect of si-SF-1/SF-1 overexpression (pSF-1) on the expression of RBMS1 and c-Myc. H and I, miR-383 mimics abrogated si-SF-1-induced RBMS1/c-Myc expression. Representative Western blotting for c-Myc (upper bands), RBMS1 (middle bands), and GAPDH (lower bands) (H) and the corresponding densitometric analysis (I) are shown. The ratio of the c-Myc/RBMS1 band intensity over the GAPDH band intensity in controls was arbitrarily set at 1.0. J, Luciferase activity of wild-type RBMS1 3′-UTR in NIH3T3 cells cotransfected with either pEGFP-SF-1 vector or control vector and miR-383 inhibitors/inhibitors NC. Left panel, Luciferase activity was measured 24 h after transfection. Right panel, Validation of SF-1 overexpression in NIH3T3 cell line. In A–E, I, and J, data were presented as means ± sem for at least three independent experiments. **, P < 0.01.

