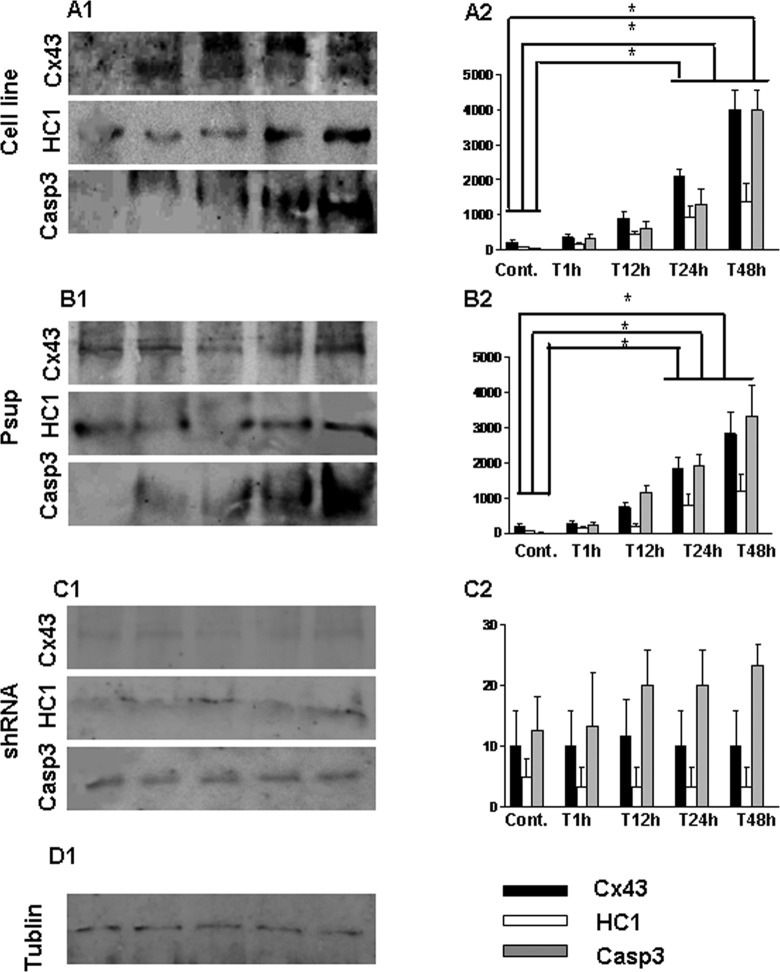
Figure 6.
Western blot analysis of Cx43, HC1, and Casp3 expression from astrocytes following OGD treatment. Astrocytes were treated with OGD techniques. The lysates were resolved by SDS-PAGE, and immunopositive bands were semiquantified by scanning laser densitometry. Data are expressed as mean ± SD corresponding to data displayed, * P < .05. A1-2, Astrocytes cell line; B1-2, Psup astrocytes; C1-2, shRNA astrocytes; D1, Tublin was detected as a control. Cx43 indicates connexin 43; Casp3, caspase 3; HCl, hemichannel; OGD, oxygen–glucose deprivation; shRNA, small hairpin RNA; SDS-PAGE, sodium dodecyl sulfate–polyacrylamide gel electrophoresis; SD, standard deviation.

