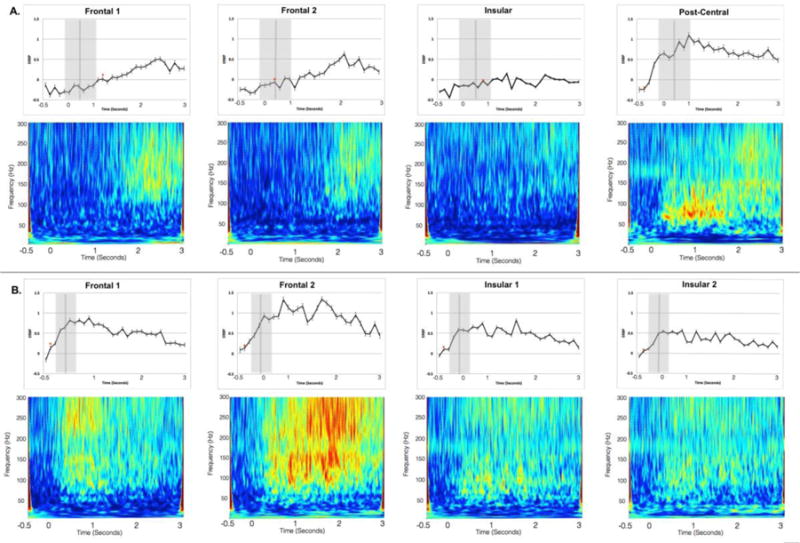
Figure 3.

Channel responses to the Speech conditions at each 100 ms time bin. Patient 1 data are presented in panel A, and Patient 2 in panel B. The 0 second time corresponds to the onset of the cue to produce speech, and the vertical grey bars correspond to the mean articulation latency from the cue to produce each target pseudoword (standard deviation indicated by the surrounding grey interval). The asterisks indicate the first time point in which ERBP for the Speech condition significantly exceeded that of the Listen condition. Spectrograms for each channel for the Speech conditions are presented below each time course figure; warmer colors (red, yellow) indicate higher activity across the three-second-response interval. The frequency bands of interest in this analysis are 75–150 Hz high gamma range.
