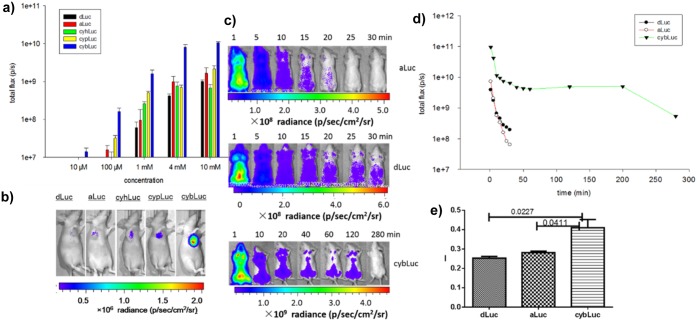
Figure 3.
Bioluminescence imaging of substrates with ES-2-Fluc tumors in nude mice (a and b): (a) integrated bioluminescence emission for mice using various concentrations of luciferins (ip; 10 μM, 100 μM, 1 mM, 4 mM, and 10 mM; 100 μL); (b) representative bioluminescence images of a nude mouse implanted with ES-2-Fluc xenografts after intraperitoneal injections of various luciferins (10 μM, 0.1 mL). Comparison of dLuc, aLuc, and cybLuc in luciferase-expressing transgenic mice (c–e): (c) representative bioluminescence images of luciferase-expressing transgenic mice administered dLuc, aLuc, and cybLuc iv (1 mM, 0.1 mL); (d) total photon output from the heads of luciferase-expressing FVB transgenic mice treated with dLuc, aLuc, or cybLuc; (e) head-to-back ratio of bioluminescence. All assays were performed in triplicate and presented as the mean ± SEM; *, P < 0.05.

