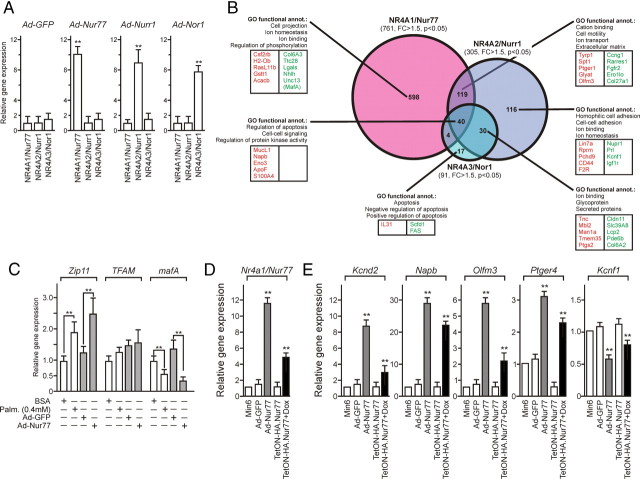
Fig. 3.
Nur77 is most efficient at regulating a transcriptional response in Min6 cells. A, Relative expression levels of NR4A after adenoviral transduction. Min6 cells were transduced at MOI 30 and mRNA were analyzed 24 h later by RT-QPCR. Basal levels were set to 1. Statistical significance was evaluated by a t test and is displayed as *, P < 0.05; **, P < 0.01. B, Venn diagram and GO analysis of NR4A target genes in Min6 cells. The total number of genes modulated by each receptor is indicated in brackets, and the Venn diagram indicates specific and overlapping subsets of target genes. The GO functional classification is indicated with the five most significant categories, and the five most up-regulated (red) and most down-regulated (green) genes are mentioned for each target gene subset. C, Comparative expression levels of Nur77-regulated genes after Nur77 adenoviral transduction and palmitate treatment. Min6 cells were either transduced with Ad-Nur77 or treated with 0.4 mm palmitate for 24 h. mRNA levels were quantified by RT-QPCR and expressed relative to the basal level arbitrarily set to 1. Statistical significance was evaluated by a t test and is displayed as *, P < 0.05; **, P < 0.01; ***, P < 0.005. D, Relative Nur77 expression levels after Ad-Nur77 transduction (Ad-Nur77) or doxycyclin induction in the Tet-ON system (TetON-HA.Nur77). Results are expressed as in panel C. E, Comparative expression levels of Nur77-regulated genes in adenovirally transduced or TetON-HA.Nur77 Min6 cells. Results are expressed as in panel C.

