
Fig. 1.
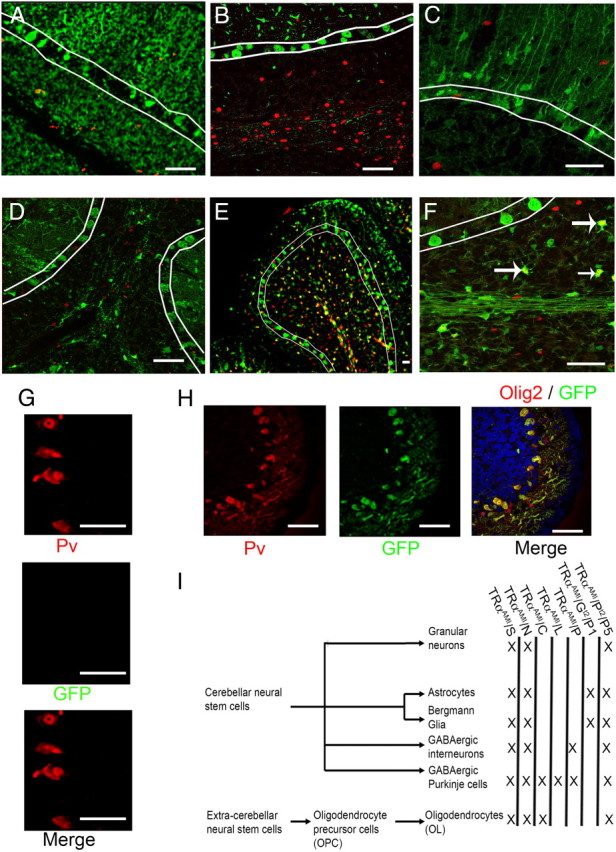
Expression pattern of different Cre-mice in the cerebellum, using ROSA26-lox-STOP-lox-EYFP (R26YFP) as reporter. A–F, Olig2 immunostaining in red; YFP immunostaining in green,. Colocalization between YFP and Olig2 (yellow) indicates Cre-mediated recombination in OPC. White lines delineate the Purkinje cell layer. A, PDGFRα-Cre ERT2 (tamoxifen injection at P1. Immunostaining at P15) indicates cre-mediated recombination in all cerebellar cell types including oligodendrocyte lineage. B, L7-Cre (P15). Recombination is restricted to Purkinje cells. C, Glast-Cre ERT2 (tamoxifen injection at P1. Immunostaining at P15). Recombination is restricted to the astrocytes and not found in Olig2+ OPC. D, Ptfa1-Cre (P15): Recombination in GABAergic neurons, but not in oligodendrocytes lineage at P15. E and F, Cnp-Cre (P15). Recombination limited to the oligodendrocytes lineage and Purkinje cells. Stars indicate YFP+Olig2+ OPC. G, Cnp-Cre (P8, green; YFP, red; parvalbumin, blue: DAPI) indicates an expression of Cre recombinase from in Purkinje cells at this stage. H, Cnp-Cre (P3 green: YFP, red: parvalbumin). Absence of recombination at P3 in Purkinje cells at this stage. Scale bar, 100 μm. I, Cell lineages in the cerebellum and recombination patterns observed in various Cre and Cre-ERT2 transgenic mice. X indicates Cre expression. Counting and nomenclature are summarized in Table 1. GFP, Green fluorescent protein.