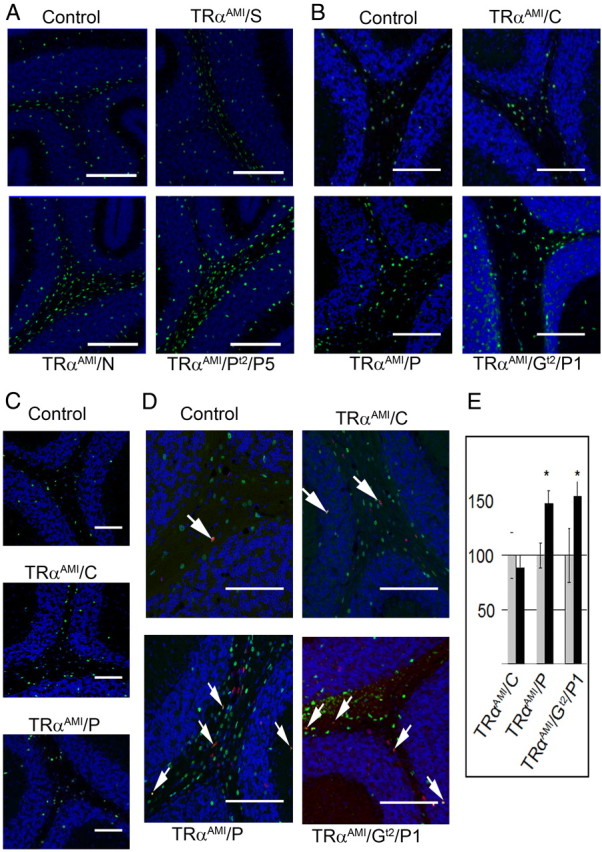
Fig. 3.

An indirect effect of T3 for OPC differentiation at P15. A, Olig2 staining at P15 (in green. DAPI Counterstain blue) indicates an increased density of OPC in TRαAMI/S (ubiquitous expression), TRαAMI/N (brain specific), and TRαAMI/PT2/P5 (pan-cerebellar expression from P5) compared with littermate control. See Table 2 for counts. B, Olig2 staining in the white matter of control (without Cre), oligodendrocyte specific (TRαAMI/C), GABAergic lineage specific (Purkinje cell and GABAergic interneurons, TRαAMI/P), and astrocyte specific from P1 (TRαAMI/GT2/P1) indicate a not cell-autonomous effect of thyroid hormone in oligodendrocyte differentiation at P15. C, Same staining at P21 indicates a transient phenotype, mainly observable at P15. D, 24 h BrdU labeling of proliferating cells. Double BrdU/Olig2+ (red/green, colocalization in yellow) E, Counting of double BrdU/Olig2+ cells indicates an increased density in proliferating OPC at P15 when TRα1L400R is expressed in GABAergic neurons (TRαAMI/P) mutants or in astrocytes (TRαAMI/GT2/P1) but not in OPC (TRαAMI/C). Data are expressed ± sd. *, Significant difference between mutants and wild types, P < 0.05. Scale bar, 50 μm.
