
Fig. 1.
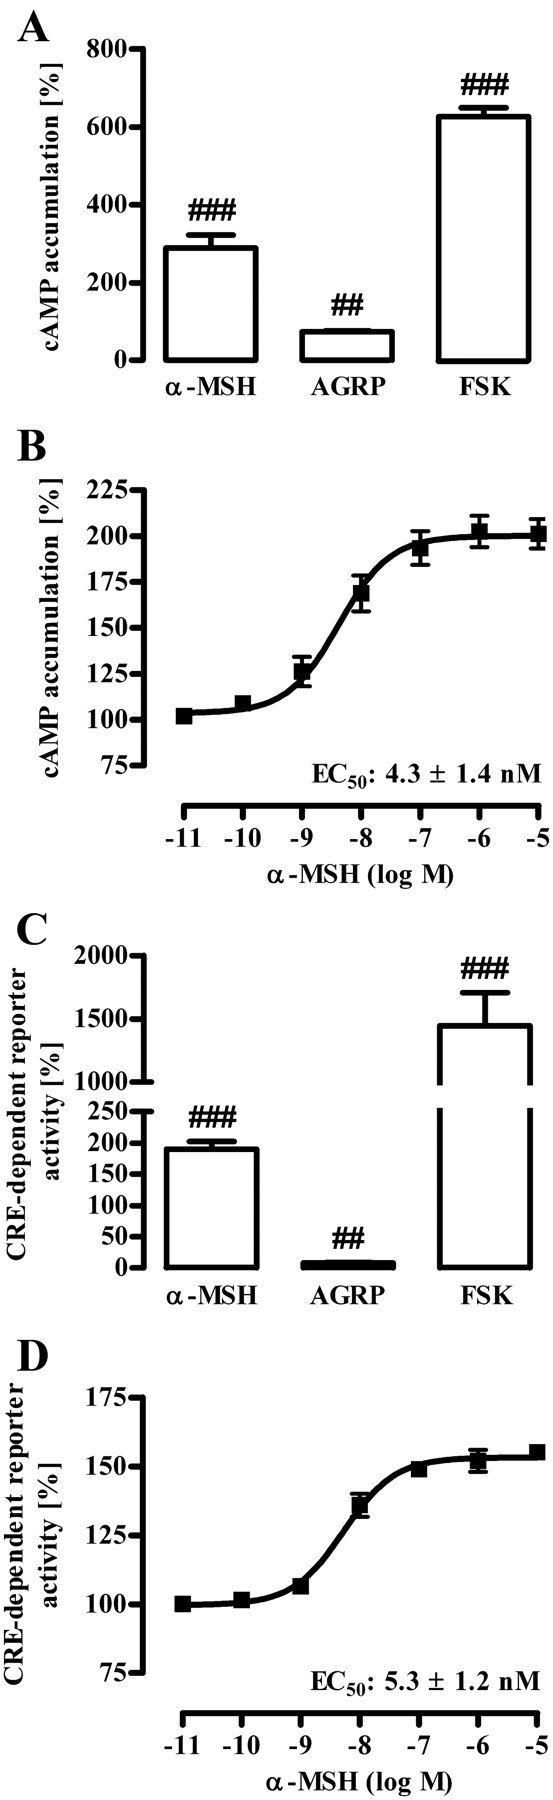
Gs-induced signaling by α-MSH in GT1-7 cells. A and B, cAMP accumulation was assessed after labeling of GT1-7 cells with [3H]adenine followed by the purification of [3H]cAMP and [3H]ATP by sequential chromatography. Cells were stimulated with 1 μm α-MSH, 100 nm AGRP, or 1 μm FSK (A) and with various concentrations of α-MSH for 60 min at 37 C (B). Five (A) and three (B) independent experiments were performed in triplicates, data compiled, normalized to basal (defined as 100%), and presented as the mean ± sem. Hashed signs indicate a significant (###, P < 0.001; ##, P < 0.01) difference to unstimulated cells. C and D, GT1-7 cells were transiently transfected with a reporter gene construct harboring the firefly luciferase gene under the control of a CRE-dependent promoter and as a control with a pcDNA3-YFP plasmid. Thirty-six hours after transfection (including 20 h of cell starvation), cells were stimulated with 1 μm α-MSH, 100 nm AGRP, or 1 μm FSK (C) and with various concentrations of α-MSH for 6 h (D). After lysis of cells, firefly luciferase activity and total YFP fluorescence were determined. Fluc/YFP ratios were calculated and then normalized by defining basal values as 100%. Results of five (C) and of three (D) independent experiments performed in triplicates are shown. Hashed signs indicate a significant (###, P < 0.001; ##, P < 0.01) difference to unstimulated cells.