
Fig. 2.
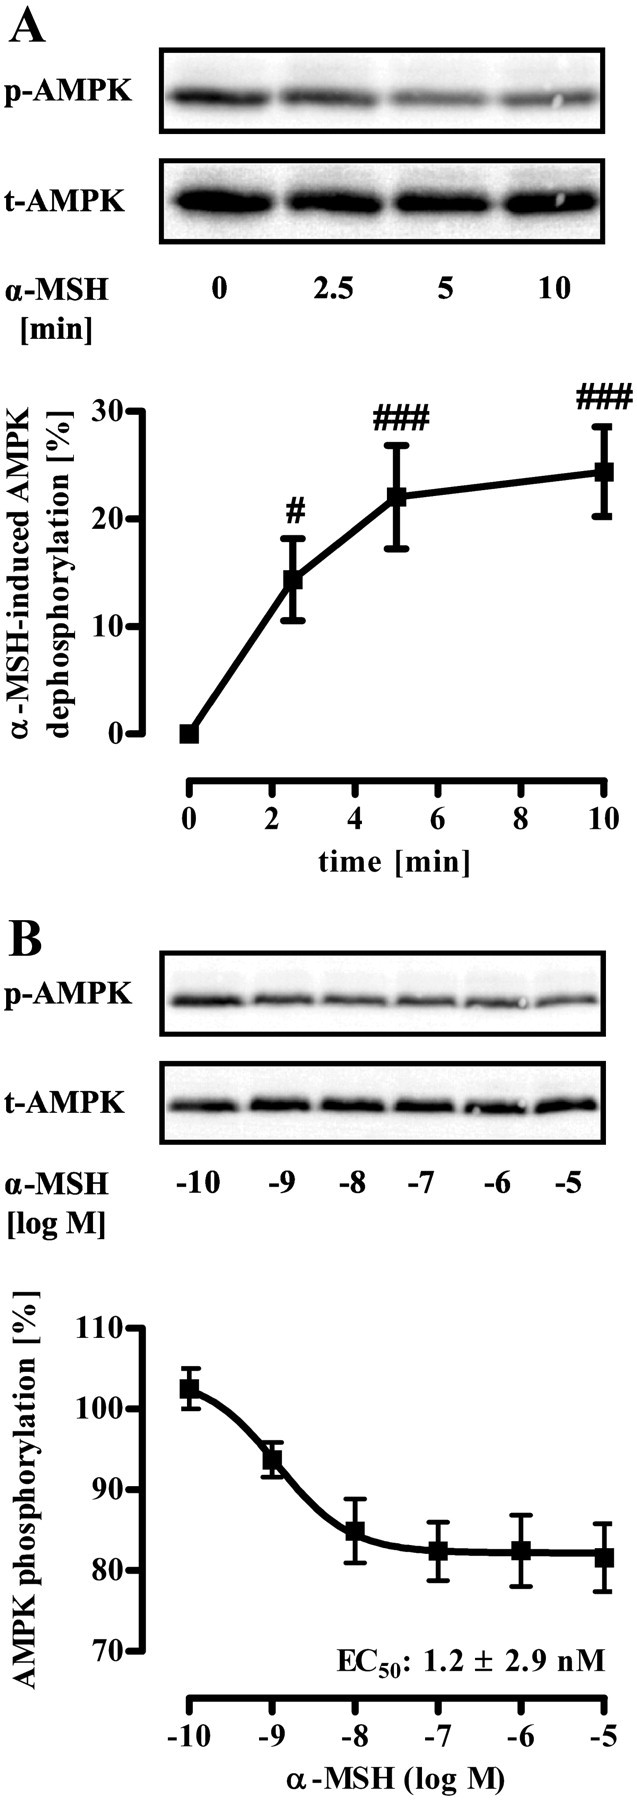
α-MSH-induced dephosphorylation of AMPK at Thr172 in GT1-7 cells monitored by Western blotting. Approximately 400,000 GT1-7 cells were grown on six-well plates, serum starved for 20 h, and stimulated with 1 μm α-MSH for various periods of time (A) or with various concentrations (B) for 10 min. Lysates were then analyzed by Western blotting using a phospho-specific antibody against Thr172 of AMPK. As a control of sample loading, the blot was stripped and reprobed with an antibody against t-AMPK-α. Representative blots are shown. Data of eight (A) and four (B) independent experiments were compiled and quantified. Data were normalized by setting values of unstimulated cells (basal) as 100%. A, α-MSH-induced dephosphorylation was calculated by subtracting values of stimulated cells from 100% and is shown as the mean ± sem. Hashed signs indicate a significant (#, P < 0.05; ###, P < 0.001) difference between treated and nontreated cells.