Fig. 3.
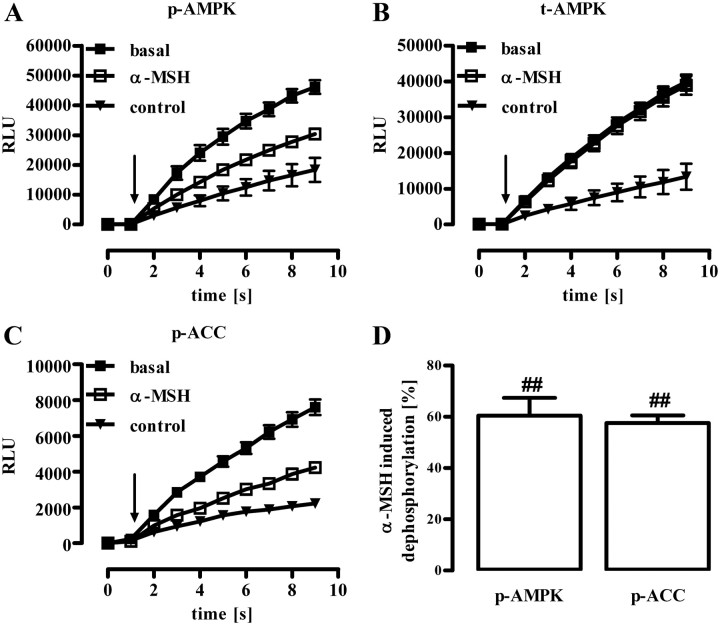
α-MSH-induced dephosphorylation of AMPK (Thr172) or of ACC (Ser79) in GT1-7 cells monitored by whole-cell ELISA. Approximately 25,000 GT1-7 cells were seeded into white 96-well dishes. After 20 h of serum starvation, cells were stimulated with 1 μm α-MSH for 10 min and phosphorylation of AMPK at Thr172 (A), total AMPK levels (B), or phosphorylation of ACC at Ser79 (C) monitored by specific antibodies in whole cells. Cell-bound, HRP-conjugated secondary antibody was detected by automatic injection of SuperSignal West Femto HRP substrate in a FLUOstar Omega plate reader at time point 1 sec (as indicated by the arrow) and total luminescence recorded for additional 8 sec. As a control, luminescence signals were measured in samples without any first antibody. A–C, Raw data (eight replicates) of one representative experiment are shown as the mean ± sem. D, Data of three independent experiments were compiled, control values subtracted and normalized by setting RLU values of unstimulated cells (basal) at time point 9 sec as 100%. α-MSH-induced dephosphorylation was than calculated by subtracting values of stimulated cells from 100%. Hashed signs (##, P < 0.01) indicate a significant difference to unstimulated cells (basal).

