
Fig. 7.
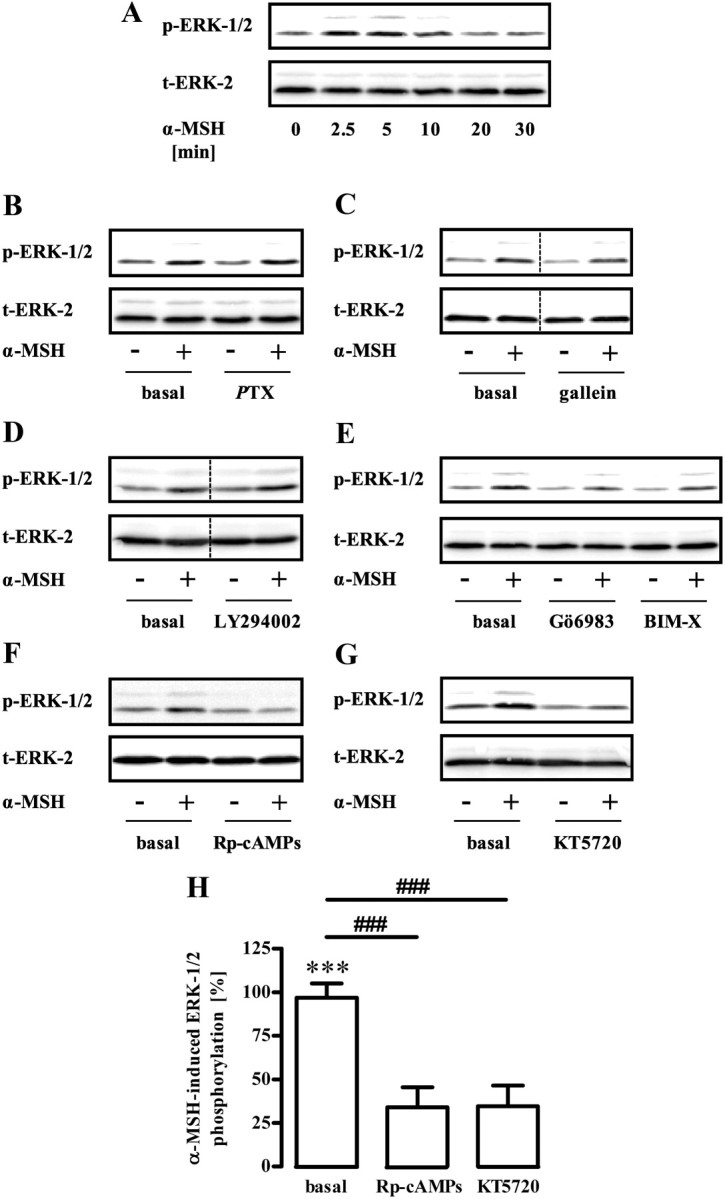
Role of PKA for α-MSH-induced phosphorylation of ERK-1/2. A, Approximately 400,000 GT1-7 cells were grown in six-well plates, serum starved for 20 h, and stimulated with 1 μm α-MSH for various periods of time. Lysates were then analyzed by Western blotting using a phospho-specific antibody against phosphorylated ERK-1/2. Afterwards, blots were stripped and reprobed with an antibody against ERK-2. One representative blot out of three experiments is shown. B–G, Phosphorylation of ERK-1/2 was monitored as described in A with the alteration that cells were stimulated with 1 μm α-MSH for 3 min and pretreated or not with (B) 100 ng/ml PTX over night, (C) with 10 μm gallein, (D) with 20 μm LY294002, (E) with 1 μm Gö6983 or BIM-X, (F) with 50 μm Rp-cAMPs, or (G) with 5 μm KT5720 for 30 min. One representative blot is shown for each condition. The dotted line indicates grouping of different lanes from the same gel. H, Data of 10 independent experiments with Rp-cAMPs or KT5720 were compiled, normalized by setting values of unstimulated cells (basal) or with inhibitor-treated cells as 100%. α-MSH-induced dephosphorylation was calculated by subtracting values of stimulated cells from 100% and are shown as the mean ± sem. Asterisks indicate a significant (***, P < 0.001) difference to zero. Hashed signs indicate a significant (###, P < 0.001) difference between Rp-cAMPs or KT5720-treated cells and basal.