
Fig. 12.
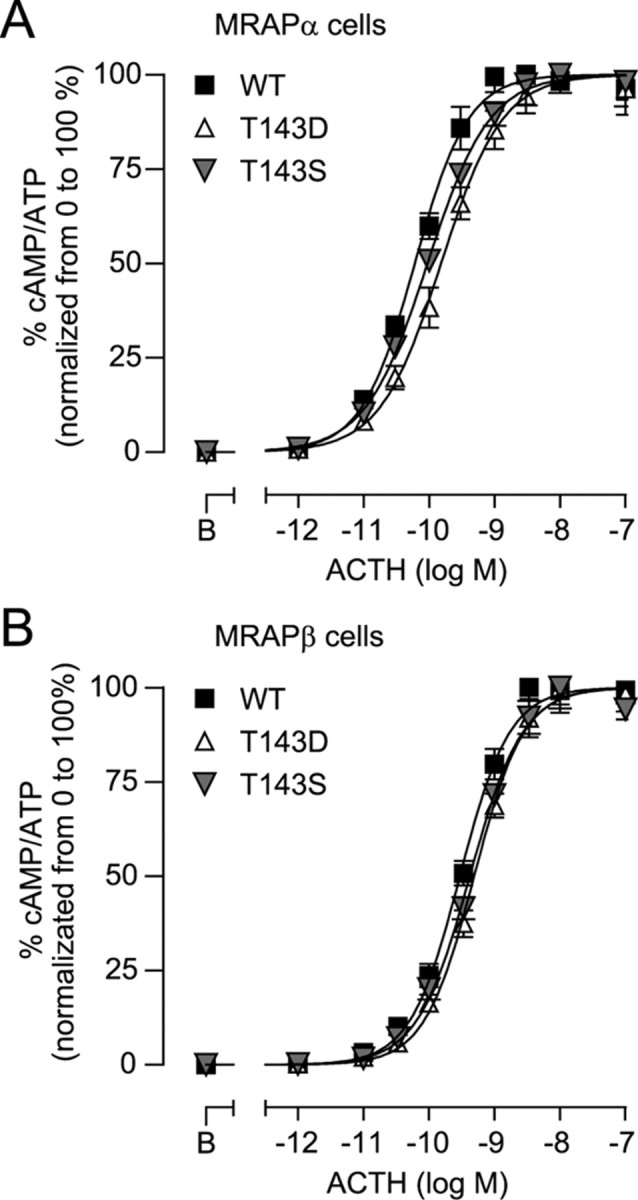
Functionality of T143 mutants. A and B, 293/FRT/MRAPα-Flag (A) or 293/FRT/MRAPβ-Flag (B) cells, transiently transfected with WT, T143D, or T143S, were washed and incubated with varying ACTH concentrations in the presence of IBMX for 15 min. The data obtained was normalized from 0 to 100% (basal to Rmax) for each transfection to visualize EC50 values. Curves were fitted with a log agonist vs. response nonlinear regression. Results are expressed as mean ± sem of three separate experiments, each performed in triplicate.