
Fig. 4.
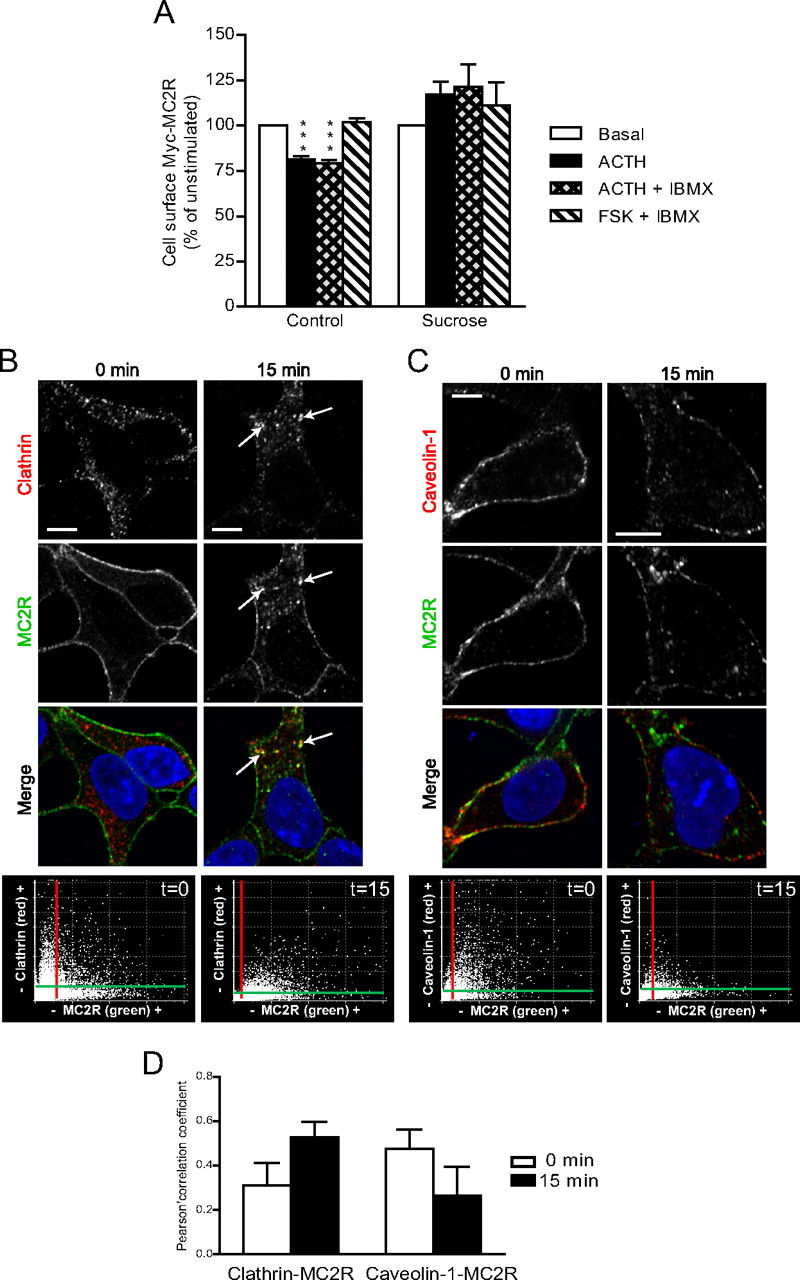
Clathrin-mediated MC2R internalization. A, 293/FRT/Myc-MC2R/MRAPβ-Flag cells were preincubated or not with 450 mm sucrose and stimulated with vehicle, 100 nm ACTH, 100 nm ACTH + 1 mm IBMX, or 10 μm FSK + 1 mm IBMX for 30 min followed by measurement of cell-surface MC2R by ELISA. Results are expressed as mean ± sem and are representative of three separate experiments. Statistical significance, compared with control: ***, P < 0.001. B and C, 293/FRT/Myc-MC2R/MRAPβ-Flag cells were stimulated with ACTH 100 nm for 15 min and processed for static immunofluorescence microscopy. Clathrin (B) or caveolin-1 (C) and Myc-MC2R were indirectly labeled with rabbit polyclonal antibodies against the native proteins or mouse monoclonal anti-Myc antibody and detected with appropriate Alexa Fluor-labeled secondary antibodies. Clathrin and Caveolin-1 are labeled in red and MC2R in green pseudocolors in merged images. Arrows point at colocalization (yellow color). Colocalization fluorograms based on three-dimensional reconstructions are shown in the right column, as described in Fig. 2. Images are representative of two independent experiments where at least 50 cells were examined. Scale bars, 10 μm. D, Histogram representation of the mean ± sem of the Pearson's correlation coefficient of data from three to eight different cells; 0 indicates no significant correlation, and 1.0 indicates complete correlation.