
Fig. 3.
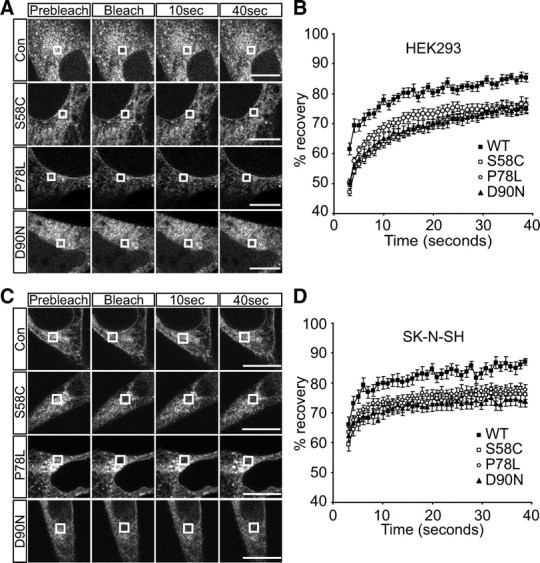
Misfolded MC4R is less mobile than WT protein at ER membranes. Representative images of live cell FRAP analysis of WT and mutant MC4R-GFP in HEK293 (A) and SK-N-SH cells (C). Graphical representation of recovery after photobleaching of WT and mutant MC4R-GFP in HEK293 (B) and SK-N-SH cells (D). A 2 × 2 μm area of the ER corresponding to the boxed areas was photobleached and the cells images every second for 40 sec. Fluorescent intensities of the 2 × 2 μm area were normalized to prebleach levels at 100%. Error bars represent se, n = 15. Con, Control.