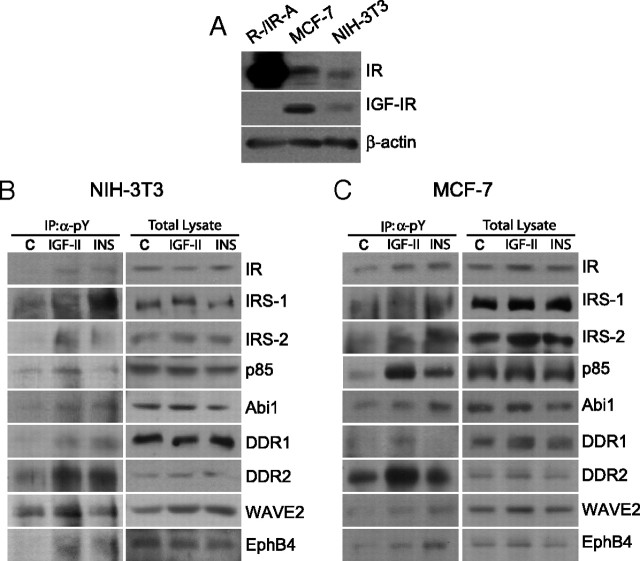
Fig. 4.
Western blot analysis of the activation of selected IR-A substrates in NIH-3T3 and MCF-7 cells. A, Proteins levels for the IR and IGF-IR in R−/IR-A, MCF-7 and NIH-3T3 cell lines. NIH-3T3 (B) and MCF-7 (C) cells were stimulated with either IGF-II or insulin at a concentration of 10 nm for 1 min. Cell lysates were subjected to IP with antianti-pY antibodies and to SDS-PAGE. Filters were then blotted with antibodies against the indicated substrates (left panel). Whole-cell lysates were also analyzed by Western blotting to provide a control for equal loading (right panel). The experiment shown is representative of three independent experiments. IP, Immunoprecipitation.

