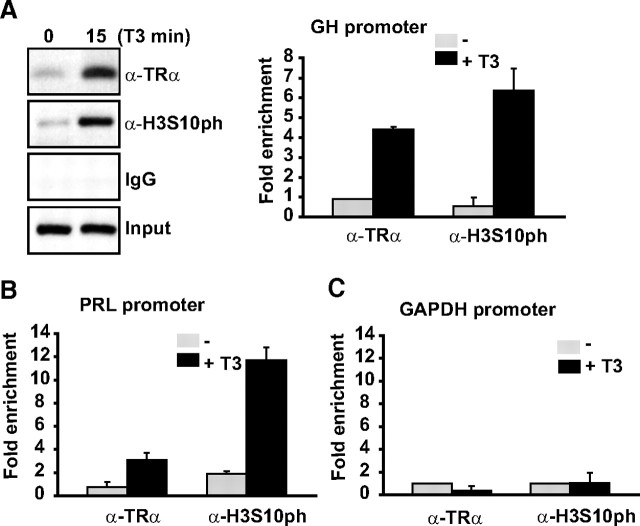
Fig. 2.
T3-regulated genes showed increased levels of H3Ser10ph after 15-min treatment with 5 nm T3. A, Representative ChIP assay in GH4C1 cells using the indicated antibodies and primers flanking the TRE region of the GH promoter (left). Real-time quantitative PCR (QRT-PCR) of several ChIP assays (right). Bars represent mean ± sd (n > 3). ChIP assays were performed in GH4C1 cells maintained in the presence and absence of T3 (5 nm, 15min). B and C, Immunoprecipitated chromatin was quantified by real-time PCR using primers flanking the TRE element in the Prolactin gene and GAPDH gene primers that was used as negative control. Bars represent mean ± sd (n =3).

