Fig. 2.
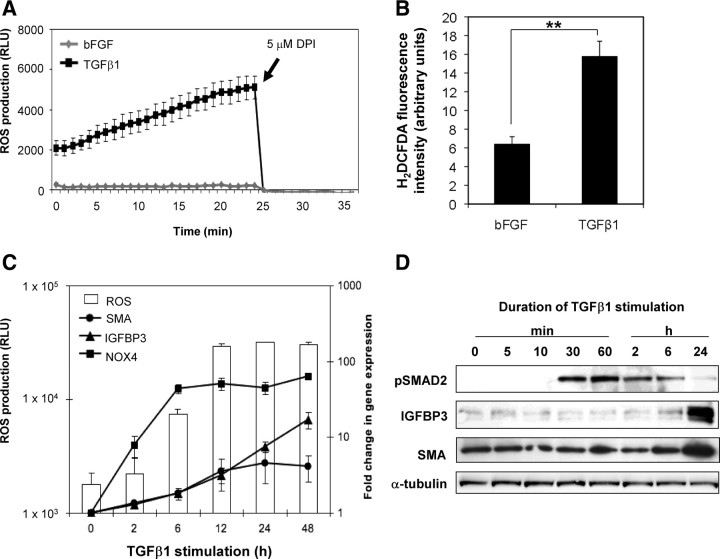
Sustained ROS production precedes fibroblast-to-myofibroblast differentiation. A, ROS production was measured real-time in PrSCs 24 h after stimulation with TGFβ1 or bFGF as control via luminol-based chemiluminescence. Values represent mean of triplicate wells (±sem). A representative example of at least three experiments using independent donors is shown. B, ROS production was measured in PrSCs 48 h after stimulation with TGFβ1or bFGF via H2DCFDA staining and analyzed by fluorescence-activated cell sorting. Values represent mean fluorescence of triplicate samples using three different donors in independent experiments. Significance is indicated (**, P < 0.01). C, Time course assay of ROS production (left y-axis) and qPCR (right y-axis) of PrSCs stimulated for the indicated duration with TGFβ1. Mean values obtained from at least three experiments using independent donors are shown (±sem). D, Western blotting of lysates from PrSCs stimulated with TGFβ1 for the indicated duration with the antibody shown. Blots are representative of three independent experiments using different donors. RLU, Relative light units.

