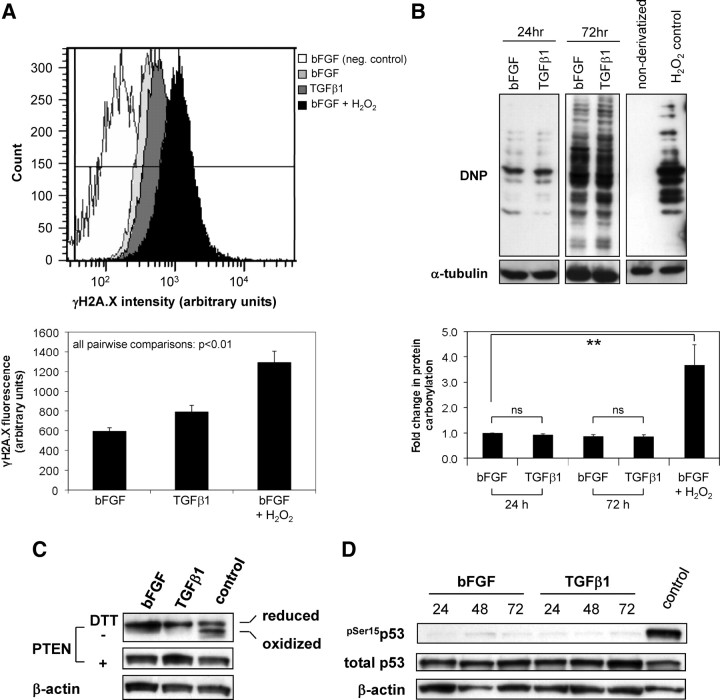
Fig. 3.
Elevated ROS production during differentiation do not induce major global DNA damage or protein oxidation. A, H2A.X phosphorylated at Ser139 was quantified via flow cytometry in PrSCs stimulated for 48 h with either bFGF or TGFβ1. Top panel, Histograms from a single experiment of γH2A.X staining intensity in PrSCs treated as indicated (negative control, omission of primary antibody in bFGF-treated samples). Note the increased (rightward) shift in staining intensity in H2O2 relative to bFGF and TGFβ1-treated samples. Lower panel, Mean values (±sem) of triplicate samples using different donors in three independent experiments. B (top panel), PrSCs were treated for the indicated duration with either bFGF or TGFβ1 before detection of total protein carbonyl levels via immunoblotting for anti-2,4-Dinitrophenol (DNP) immunoreactive proteins in cell extracts derivatized with 2,4-dinitrophenylhydrazine (DNPH). Negative control, nonderivatized cell lysate from H2O2 treated PrSCs. B (lower panel), Densitometric quantification of total protein carbonyl levels in PrSCs treated as before. Mean values (±sem) of three independent experiments using different donors are shown. Significance is indicated (**, P < 0.01; ns, not significant). C and D, Western blotting of lysates from PrSCs stimulated with bFGF or TGFβ1 for the indicated duration (panel C, 24 h; panel D, hours) with the antibody shown. Blots are representative of three independent experiments using different donors. A–D, As positive control, PrSCs were incubated with bFGF for 24 (panels B–D) or 48 h (panel A) before subsequent treatment with 250 μm H2O2 for 60 min. DTT, Dithiothreitol.

