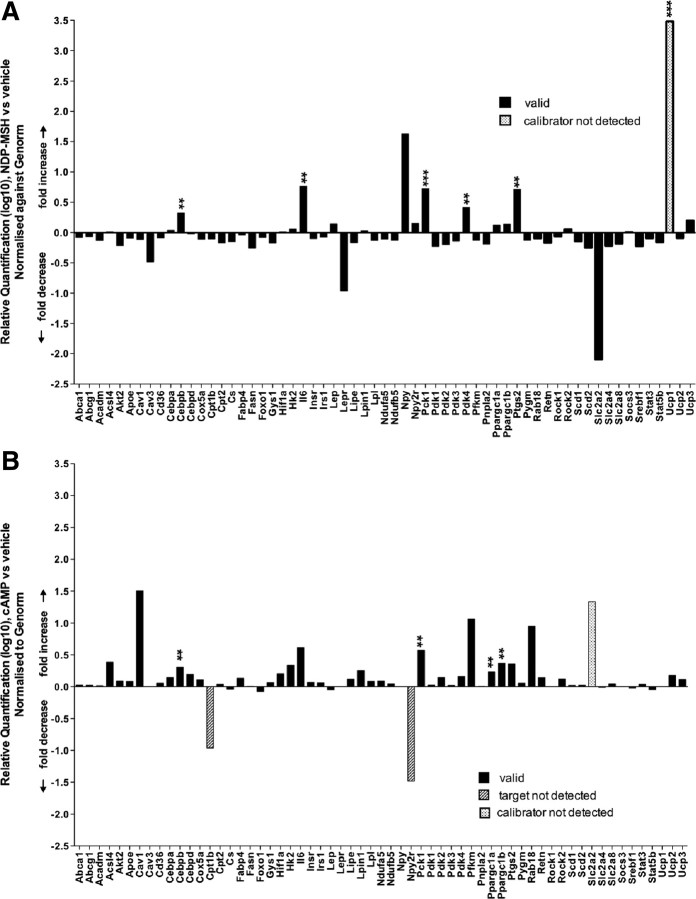
Fig. 4.
Comparison of effects on the expression of genes involved in metabolic processes between NDP-MSH- and cAMP-treated adipocytes. 3T3-L1 adipocytes were treated with either 10 nm NDP-MSH or 1 mm 8-Br cAMP for 2 h. A, Graph showing relative quantification of metabolic genes in NDP-MSH-treated adipocytes (relative to vehicle, PBS). B, Graph showing relative quantification of metabolic genes of 8-Br cAMP-treated adipocytes (relative to vehicle, PBS). Data are derived from Tables 3 and 4, respectively, expressed as fold changes normalized to the mean of Genorm-selected controls (18S rRNA, Gapdh, and GusB). Statistical analysis was performed as detailed in Fig. 1 and in Materials and Methods.

