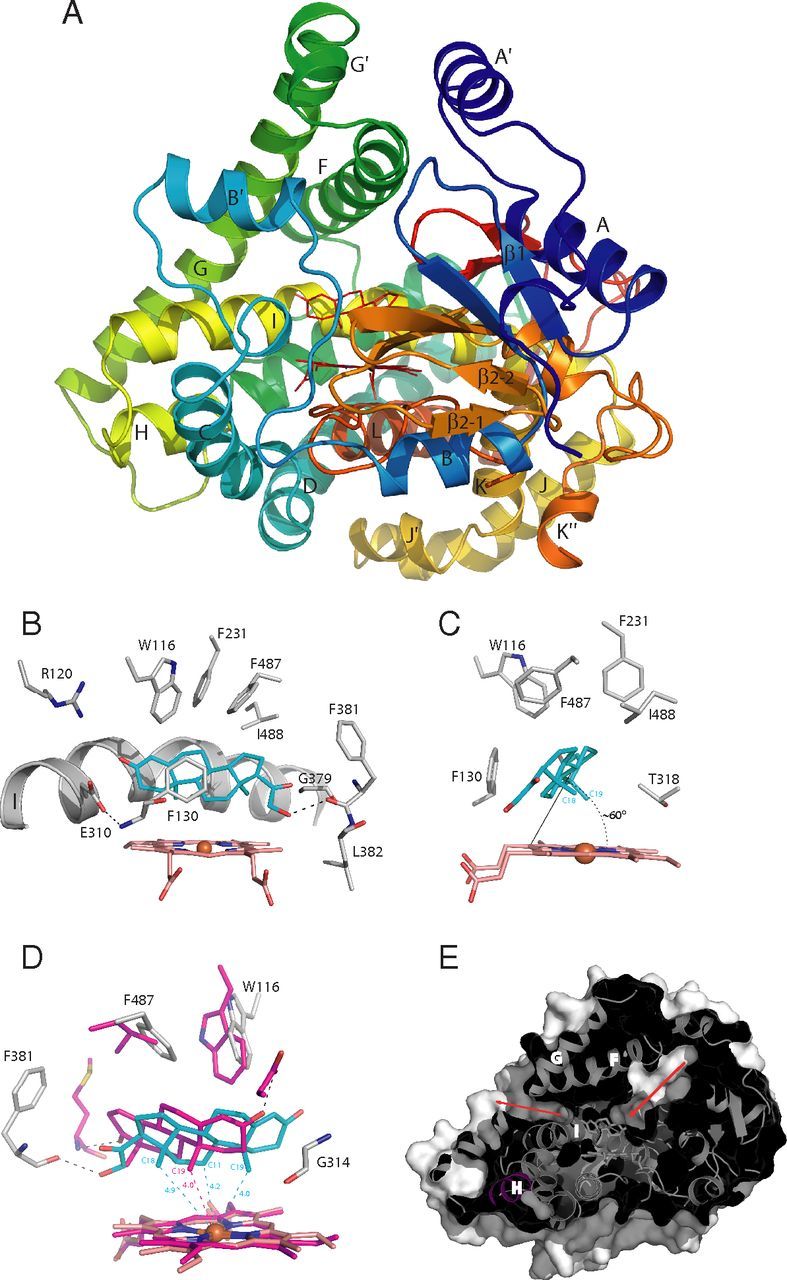
Fig. 4.

The structure of aldosterone synthase and views of steroid at the active site. A, Overall structure in a ribbon representation rainbow colored from the N terminus (blue) to the C terminus (red). B, Steroid-protein interactions. C, DOC binding angle. D, Superposition of steroids in the active sites of aldosterone synthase (cyan) and aromatase (magenta) (PDB: 3EQM) with the distances from the heme iron to hydroxylation position. E, A slice through the macromolecular surface showing channels to the active site with access and putative egress routes marked by arrows.
