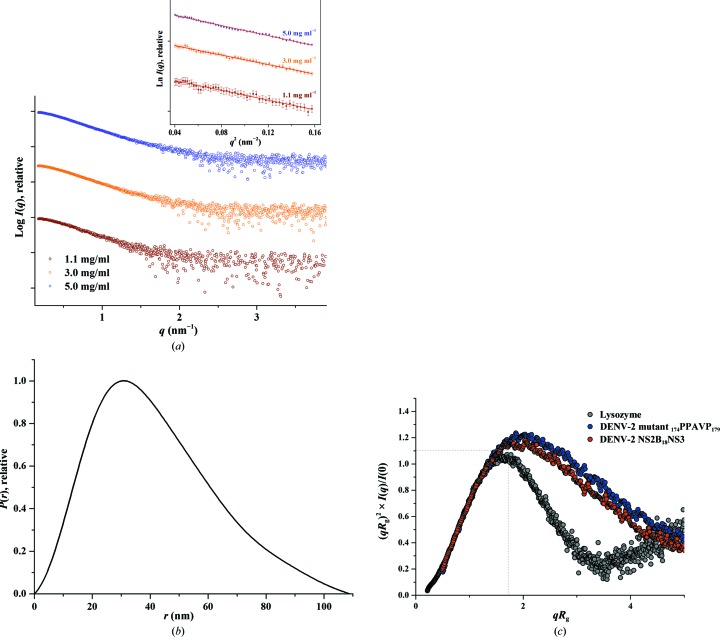
Figure 7.
SAXS studies of the DENV-2 NS3 mutant 174PPAVP179. (a) SAXS scattering patterns (circles) of the linker mutant at 1.1 mg ml−1 (brown), 3.0 mg ml−1 (orange) and 5.0 mg ml−1 (blue) concentration, which showed no concentration dependency (Supplementary Fig. S2c); all three concentrations were merged to avoid any unwanted effects arising from the slightly larger Porod volume and molecular-weight estimate at higher concentration. Inset, Guinier plots show linearity at all concentrations used, indicating no aggregation. The scattering profiles are offset for clarity by applying arbitrary scale factors. (b) P(r) function (line) of the linker mutant. (c) Comparison of normalized Kratky plots (dots) between the linker mutant (blue) and DENV-2 NS2B18NS3 (red).

