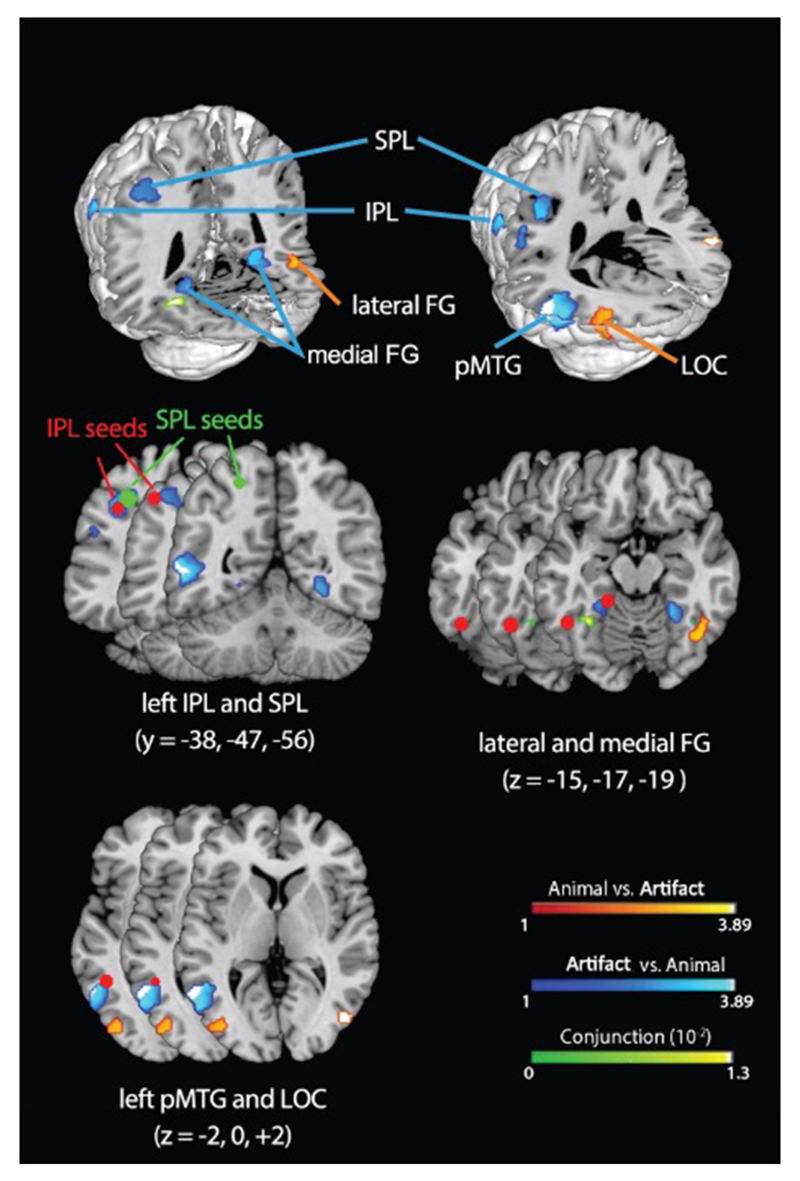
Figure 1.
ALE analysis showing regions that systematically respond more to animals than artifacts (orange), more to artifacts than animals (blue), or equally to both (green). Red dots indicate seed points from activation likelihood estimation (ALE) analysis and literature review. IPL = inferior parietal lobe, SPL = superior parietal lobe, pFG = posterior fusiform gyrus, pMTG = posterior middle temporal gyrus, LOC = lateral occipital complex.

