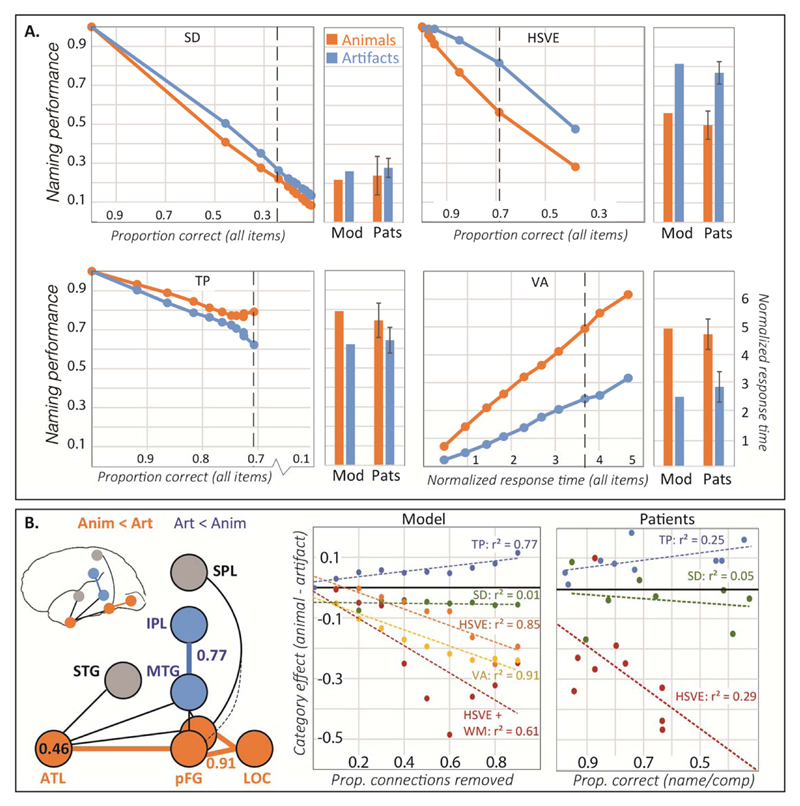
Figure 4.
Results of patient simulations. (A). Line plots show model naming accuracy for animals and artifacts at ten increasing levels of damage for each disorder plotted against overall accuracy (all items). Dashed vertical lines indicate the damage level that most closely matches mean overall accuracy in the corresponding patient group. HSVE data are for the homogeneous damage model (HSVE); data for the asymmetric damage model (HSVE+) appear in Supplementary Figure S5. Barplots show accuracy by category for the model at this level compared to patient means/standard errors reported in 79,95,96. (B). Lesion-symptom mapping results. Left: Layers/connections where lesion size predicts increasing artifact (blue) or animal (orange) disadvantage. Middle: Correlation between lesion size and category effect in each simulated patient group. Right: Category effect size in naming plotted against overall impairment as measured by word comprehension (SD and HSVE) or overall naming (TPT) in case-series studies of real patients.

