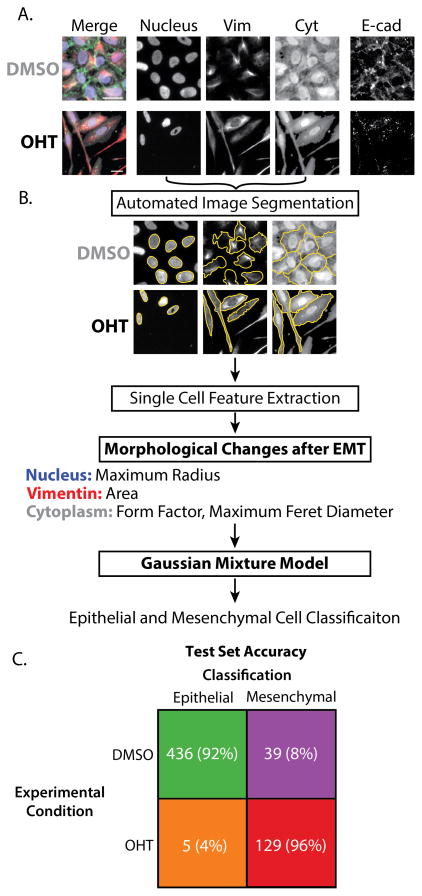
Figure 1. Classification of epithelial and mesenchymal phenotypes after 72 h DMSO (control) and OHT (Induced Snail-1), followed by 72 h DMSO.
(A) Immunofluorescent staining of nuclei, vimentin, cytoplasm and E-cadherin (blue, red, gray, and green, respectively). Scale = 25 μm. (B) Process flow of single cell segmentation and feature extraction. (C) Performance classifier of actual and predicted subpopulations with the number of cells and percent ( ) of cells in each group.

