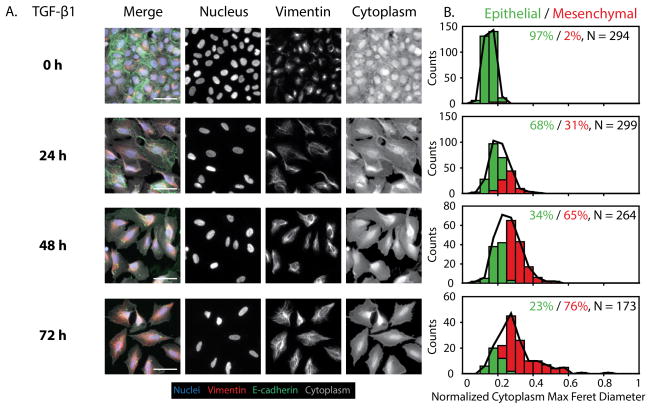
Figure 3. Time course measurements of cell morphology and biomarker expression with TGF-β1 induction.
(A) Control cells (0 h) also show characteristic epithelial features with high E-cadherin at the cell edges and low vimentin expression. 24 h TGF-β1 treatment results in loss of E-cadherin for some cells, compared with increased vimentin expression. 48 h and 72 h OHT treatment result in vimentin and cytoplasmic features with increased area and elongation. Interestingly, TGF-β1 results in a more boxy shape than with Snail-1 induction. Scale = 50 μm. (B) GMM phenotypic classification shows that 0 h is primarily epithelial (green bars and %), with a gradual increase in mesenchymal phenotypes (red bars and %) over 72 h, relative to the complete population (black line). N indicates the number of individual cells pooled per condition.

