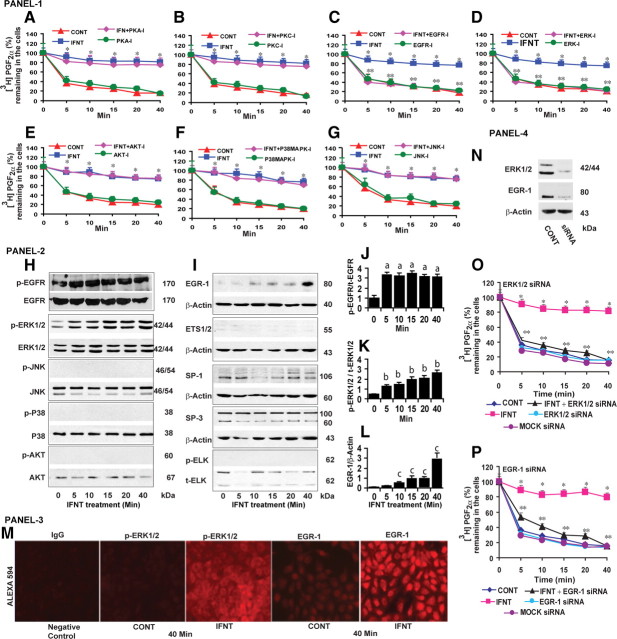
Fig. 2.
Panel 1 (A–G), Effects of PKA, PKC, EGFR, ERK1/2, AKT, P38MAPK, JNK pathways on inhibitory effects of IFNT on PGT-mediated release of PGF2α from the LE cells. CONT, Control. Inhibitors for PKA (H-89, 50 nm), PKC (GF109203, 10 μm), EGFR (AG1478, 15 μm), ERK1/2 (U0126, 10 μm), PI3K/AKT (LY294002, 50 μm), P38MAPK (SB203580, 10 μm), and JNK/SAPK (SP600125, 10 μm) were indicated by PKA-I, PKC-I, EGFR-I, ERK-I, PI3K-I, AKT-I, P38MAPK-I, and JNK-I, respectively. *, CONT vs. IFNT, P < 0.05. **, IFNT vs. IFNT+ EGFR-I or IFNT+ERK-I, P < 0.05. Panel 2 (H–I), Effects of IFNT on activation/phosphorylation of EGFR, ERK1/2, AKT, P38MAPK, JNK, EGR-1, ETS1/2, SP1, SP3, and ELK proteins, analyzed by Western blot. Total form of respective protein or β-actin protein was measured as internal control. J–L, Densitometry was determined by Alpha Imager, and relative expressions were expressed based on the integrated density values. Effects of IFNT on (a) p-EGFR protein at 0 vs. 5–40 min, (b) on p-ERK1/2 protein at 0 vs. 5–40 min, and (c) on EGR-1 protein at 0 vs. 10–40 min, P < 0.05. Panel 3 (M), Immunofluorescence analysis of p-ERK1/2 or EGR-1 protein expression and its localization in LE cells. Panel 4 (N), Knockdown of ERK1/2 or EGR-1 genes using SMARTpool siRNA resulted in 80% decrease in their respective protein level after 96 h based on Western blot analysis. O, Effects of ERK1/2 siRNA and (P) EGR-1 siRNA on the inhibitory effects of IFNT on PGT-mediated release of PGF2α in LE cells. *, CONT vs. IFNT, P < 0.05. **, IFNT vs. IFNT+ERK-siRNA or IFNT+EGR-1-siRNA, P < 0.05. All numerical values are expressed in mean ± sem of three (n = 3) independent experiments.

