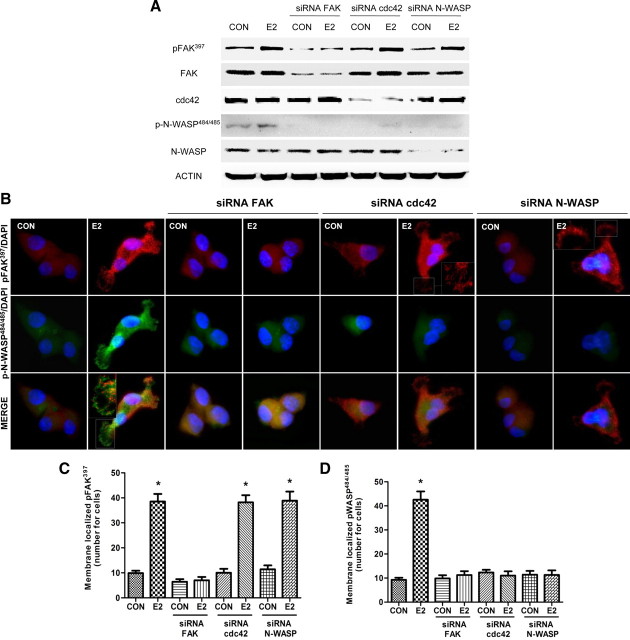
Fig. 5.
ER signals to FAK, cdc42, and N-WASP. Breast cancer cells were incubated in the presence of 10 nm E2 for 20 min with or without silencing of FAK, cdc42, or N-WASP with specific siRNAs. A, Actin, FAK, Tyr397 phospho-FAK, cdc42, N-WASP, and Ser484/485 phospho-N-WASP were assayed in cell extracts. B, Cells were stained with anti-phospho-Ser484/485 N-WASP (p-N-WASP) linked to fluorescein isothiocyante (green), and anti-phospho-Tyr397 FAK (p-FAK) linked to Texas Red (red). Nuclei were counterstained with DAPI. Double staining (yellow signal) highlights areas of colocalization. C and D, The bar graphs show the quantification of the membrane-localized Tyr397 phospho-FAK and Ser484/485 phospho-N-WASP in the different conditions. *, P < 0.05 vs. control. Membrane-localized Tyr397 p-FAK/Ser484/485 p-N-WASP complexes were counted in 40 different cells for condition. All the experiments were repeated three times with consistent results, and the representative images are shown. CON, Control.

