
Fig. 7.
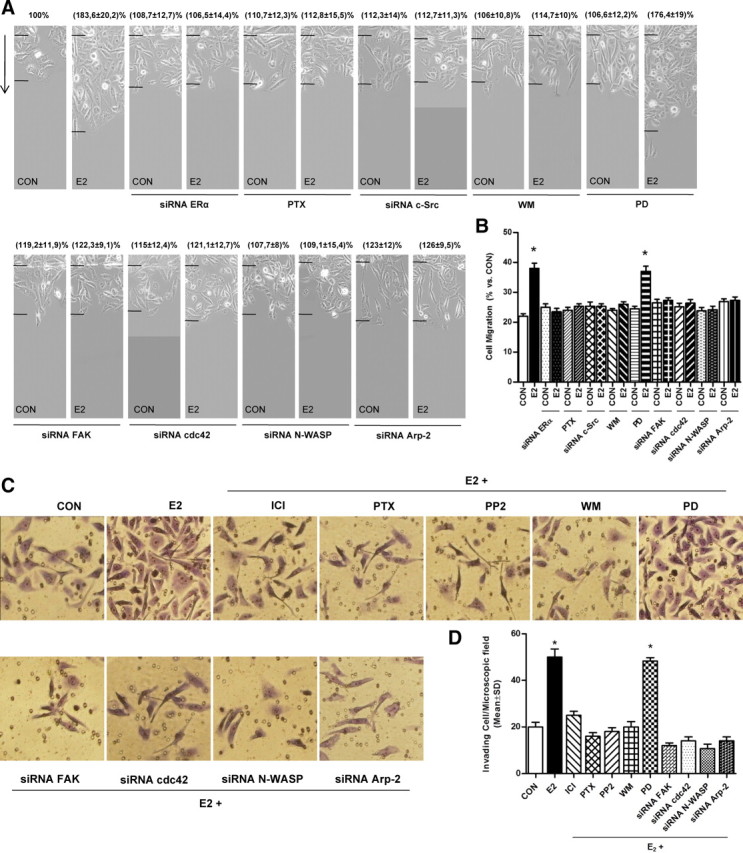
Intracellular signaling mechanisms involved in ER-enhanced T47-D cell migration and invasion. A, Cells were treated with estrogen (10 nm) for 48 h, in the presence or absence of PTX (100 ng/ml), of PD98059 (PD, 5 mm), or WM (30 nm). Other cells were transfected with siRNAs toward ERα, c-Src, FAK, cdc42, N-WASP, and Arp-2. Representative images are shown. The arrows indicate the direction of migration. The upper black lines indicate the starting line, and the lower black lines indicate the mean migration distance. B, Cell migration distances were measured, and values are presented as percent of control (CON). *, P < 0.01 vs. control. The experiments were performed in triplicate. C, T47-D cells were treated with 10 nm E2 in the presence or absence of different inhibitors or siRNAs as indicated in panel A. Breast cancer cell invasion through Matrigel was assayed with invasion chambers. Representative images in chambers with Matrigel are shown. D, Invading cells were counted in the central field of triplicate membranes. *, P < 0.05 vs. control.